Walk the walk
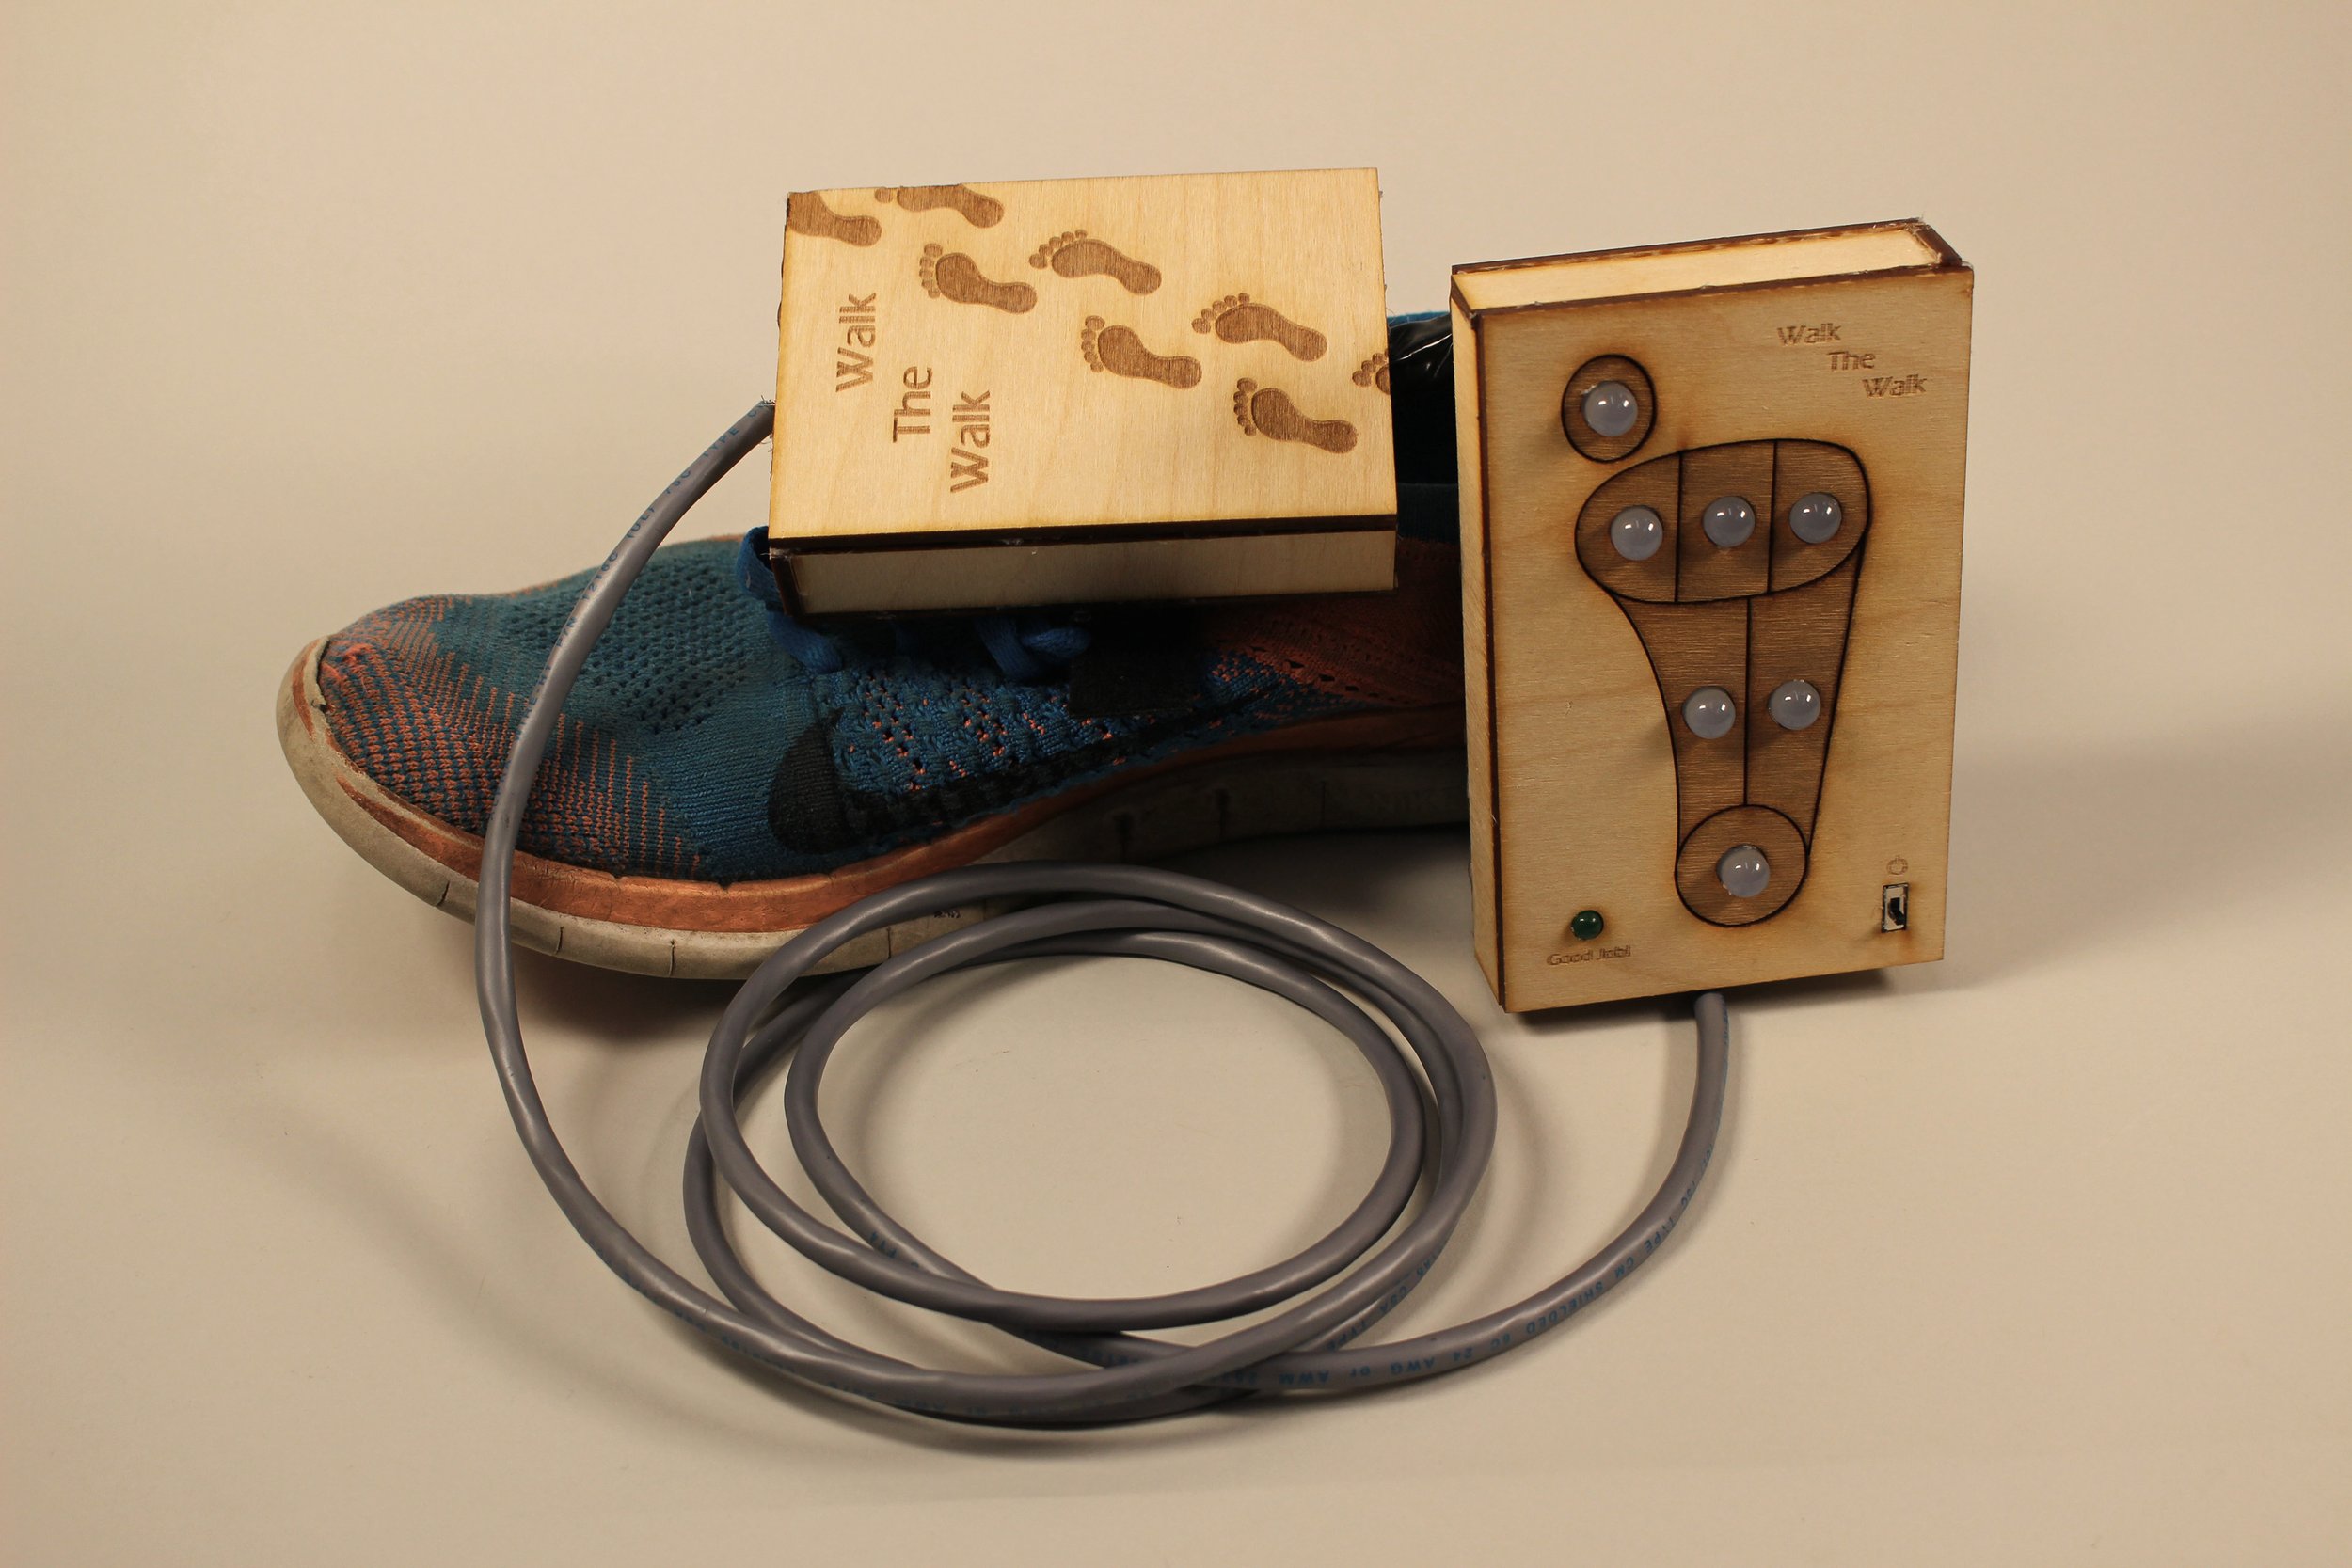
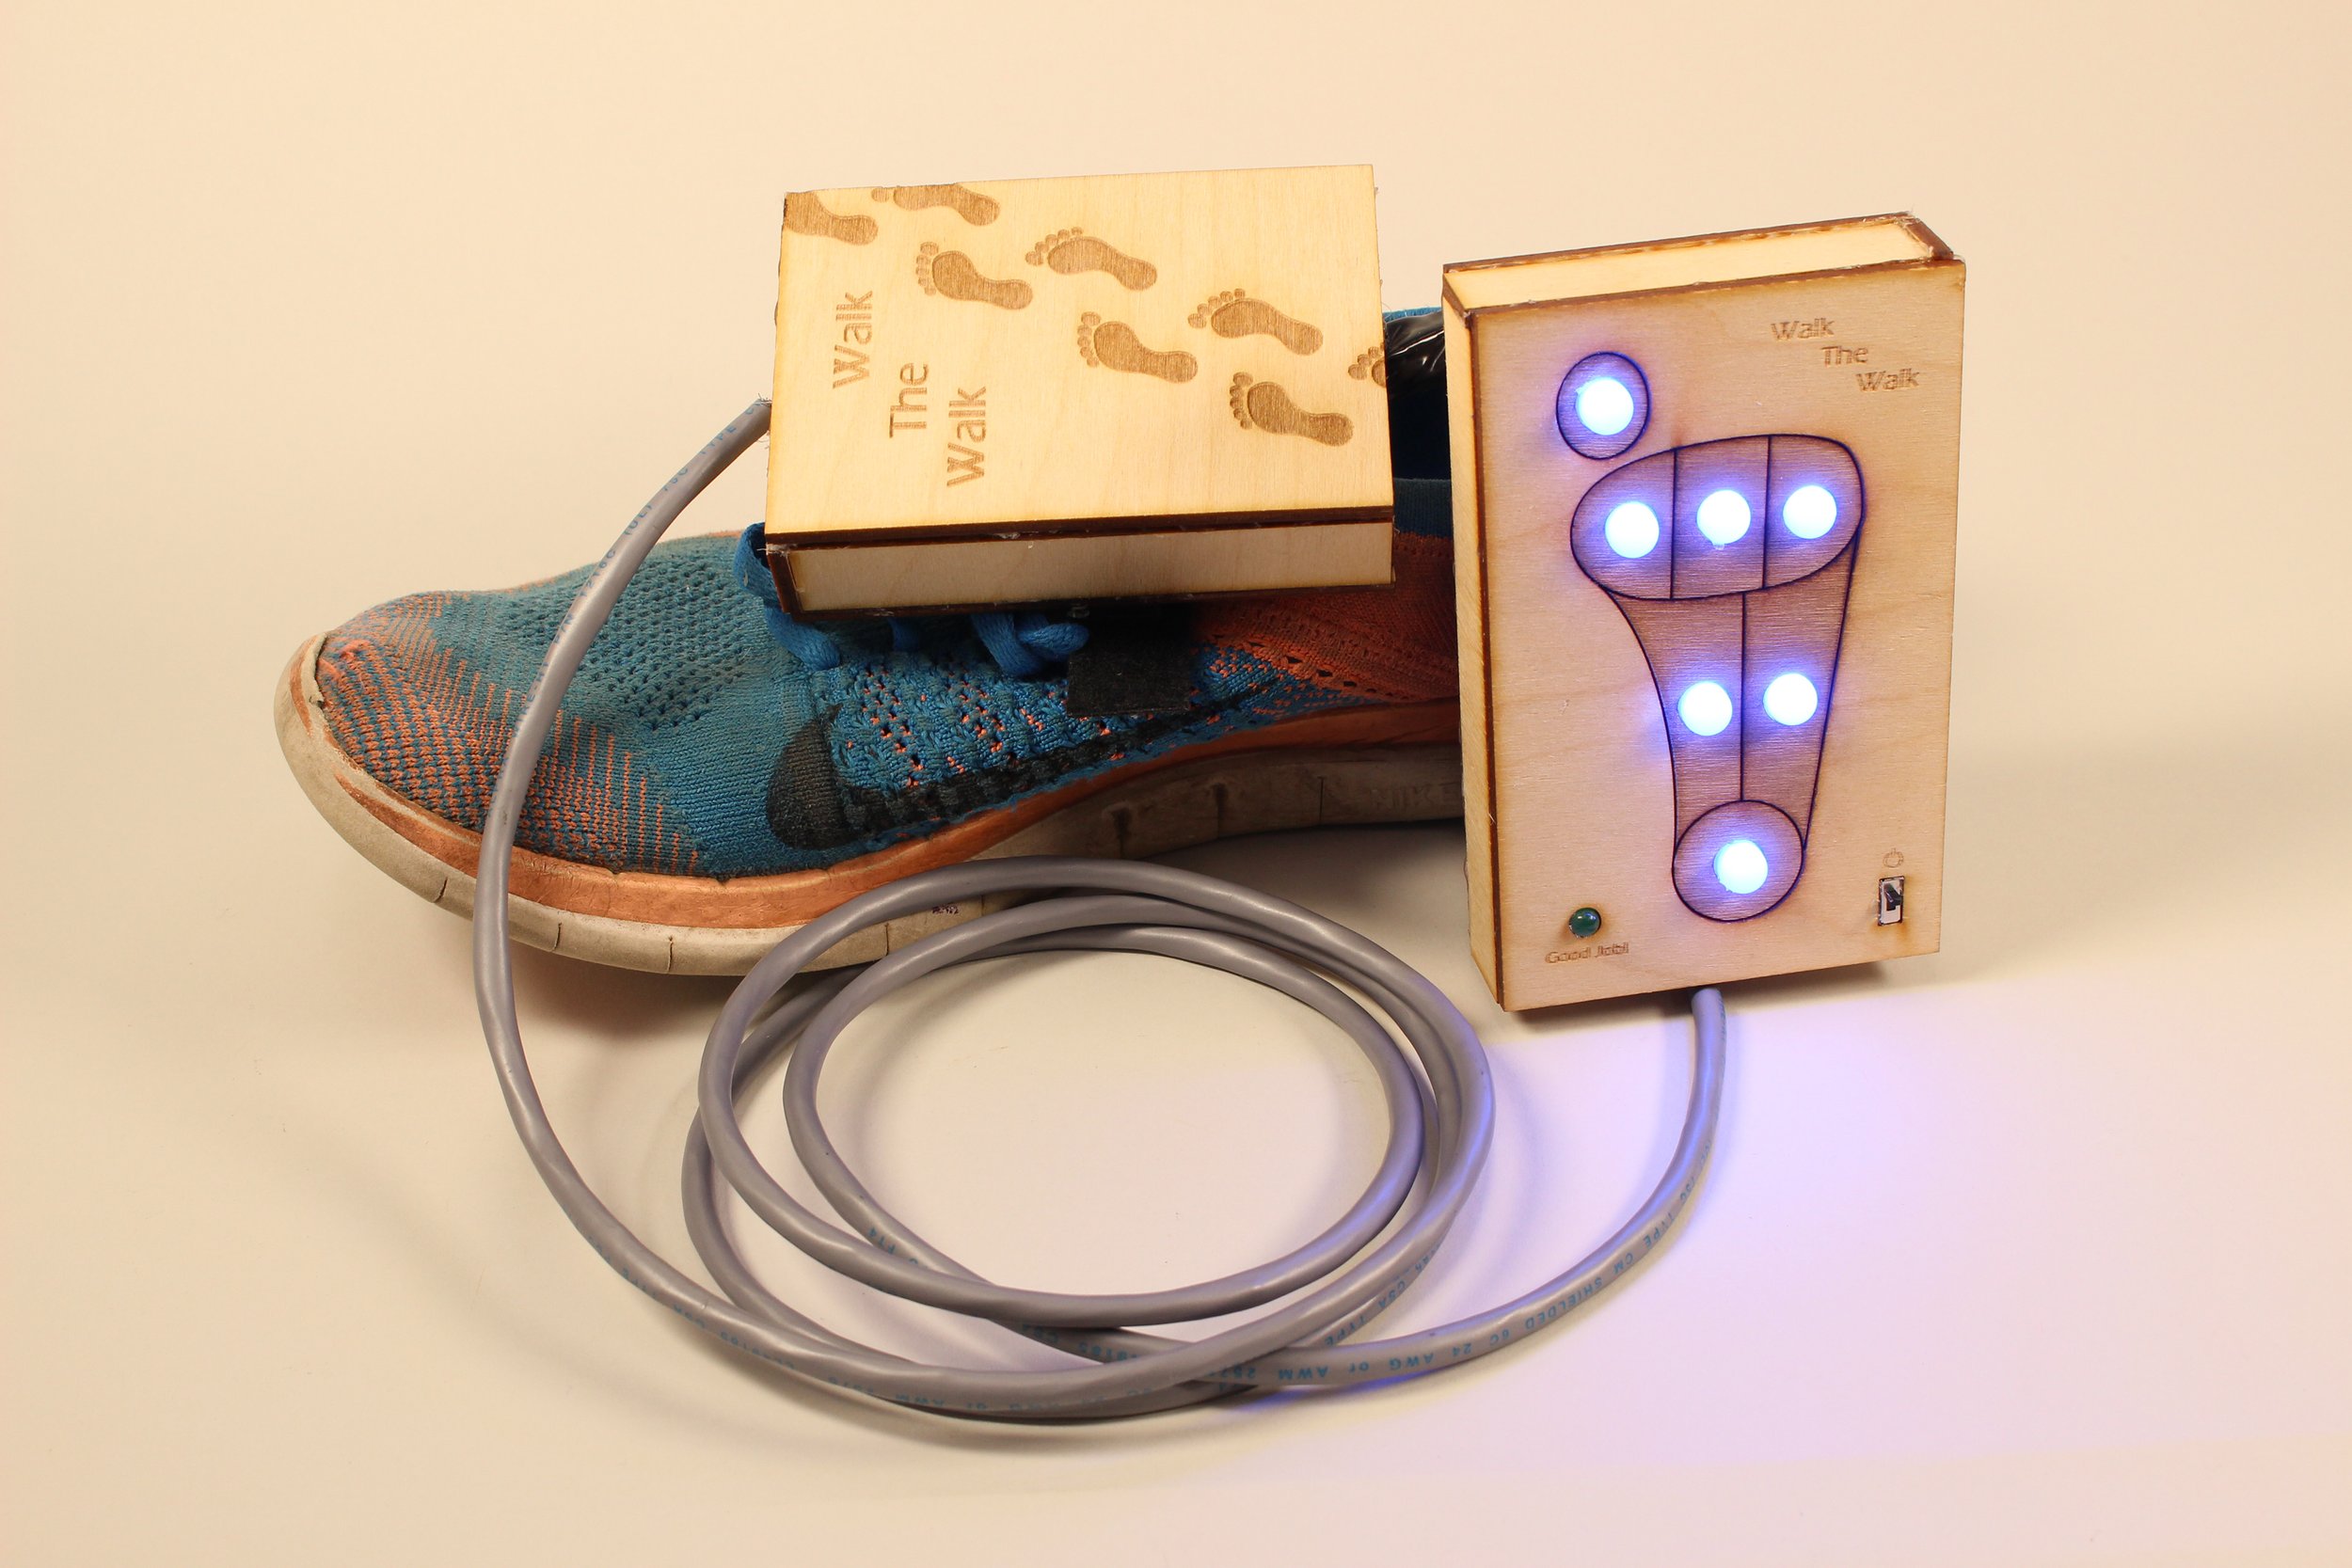
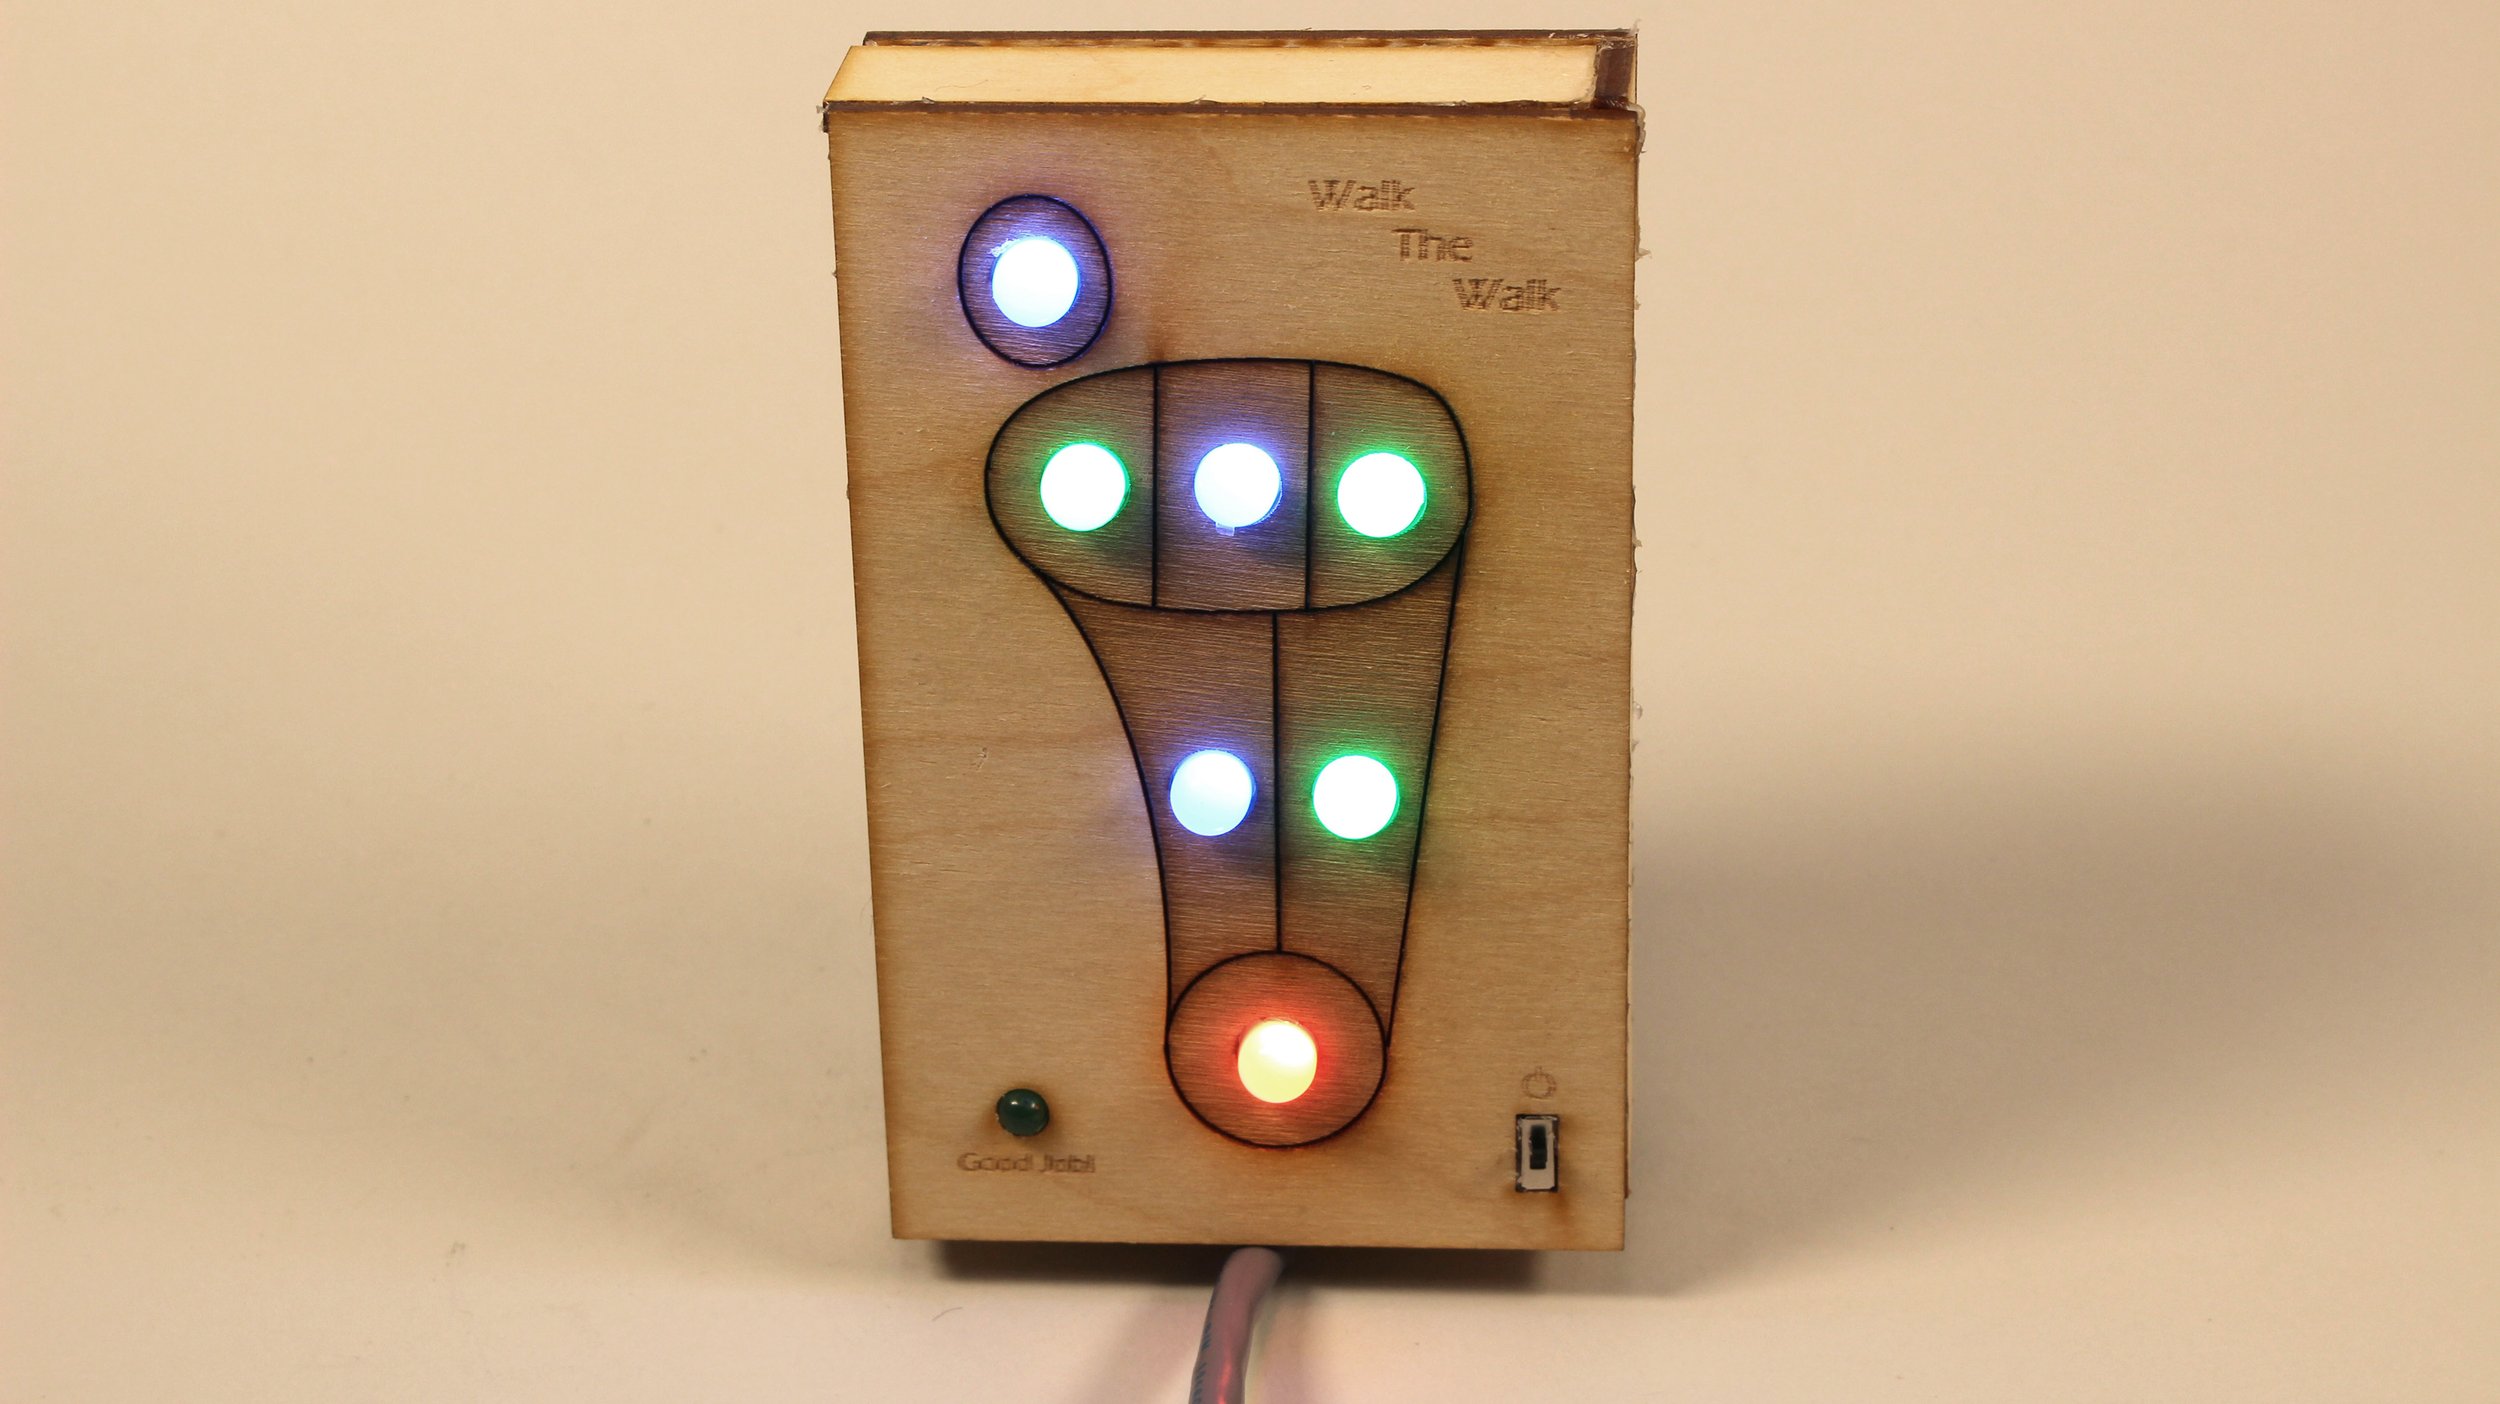
This project uses 7 pressure sensors in strategic locations in a shoe to visually display the pressure distribution someone puts on their feet. The pressure is displayed using corresponding LEDs to map out the color based on the amount of pressure. Also, if the correct pressure distribution is reached, then a green LED lights up.


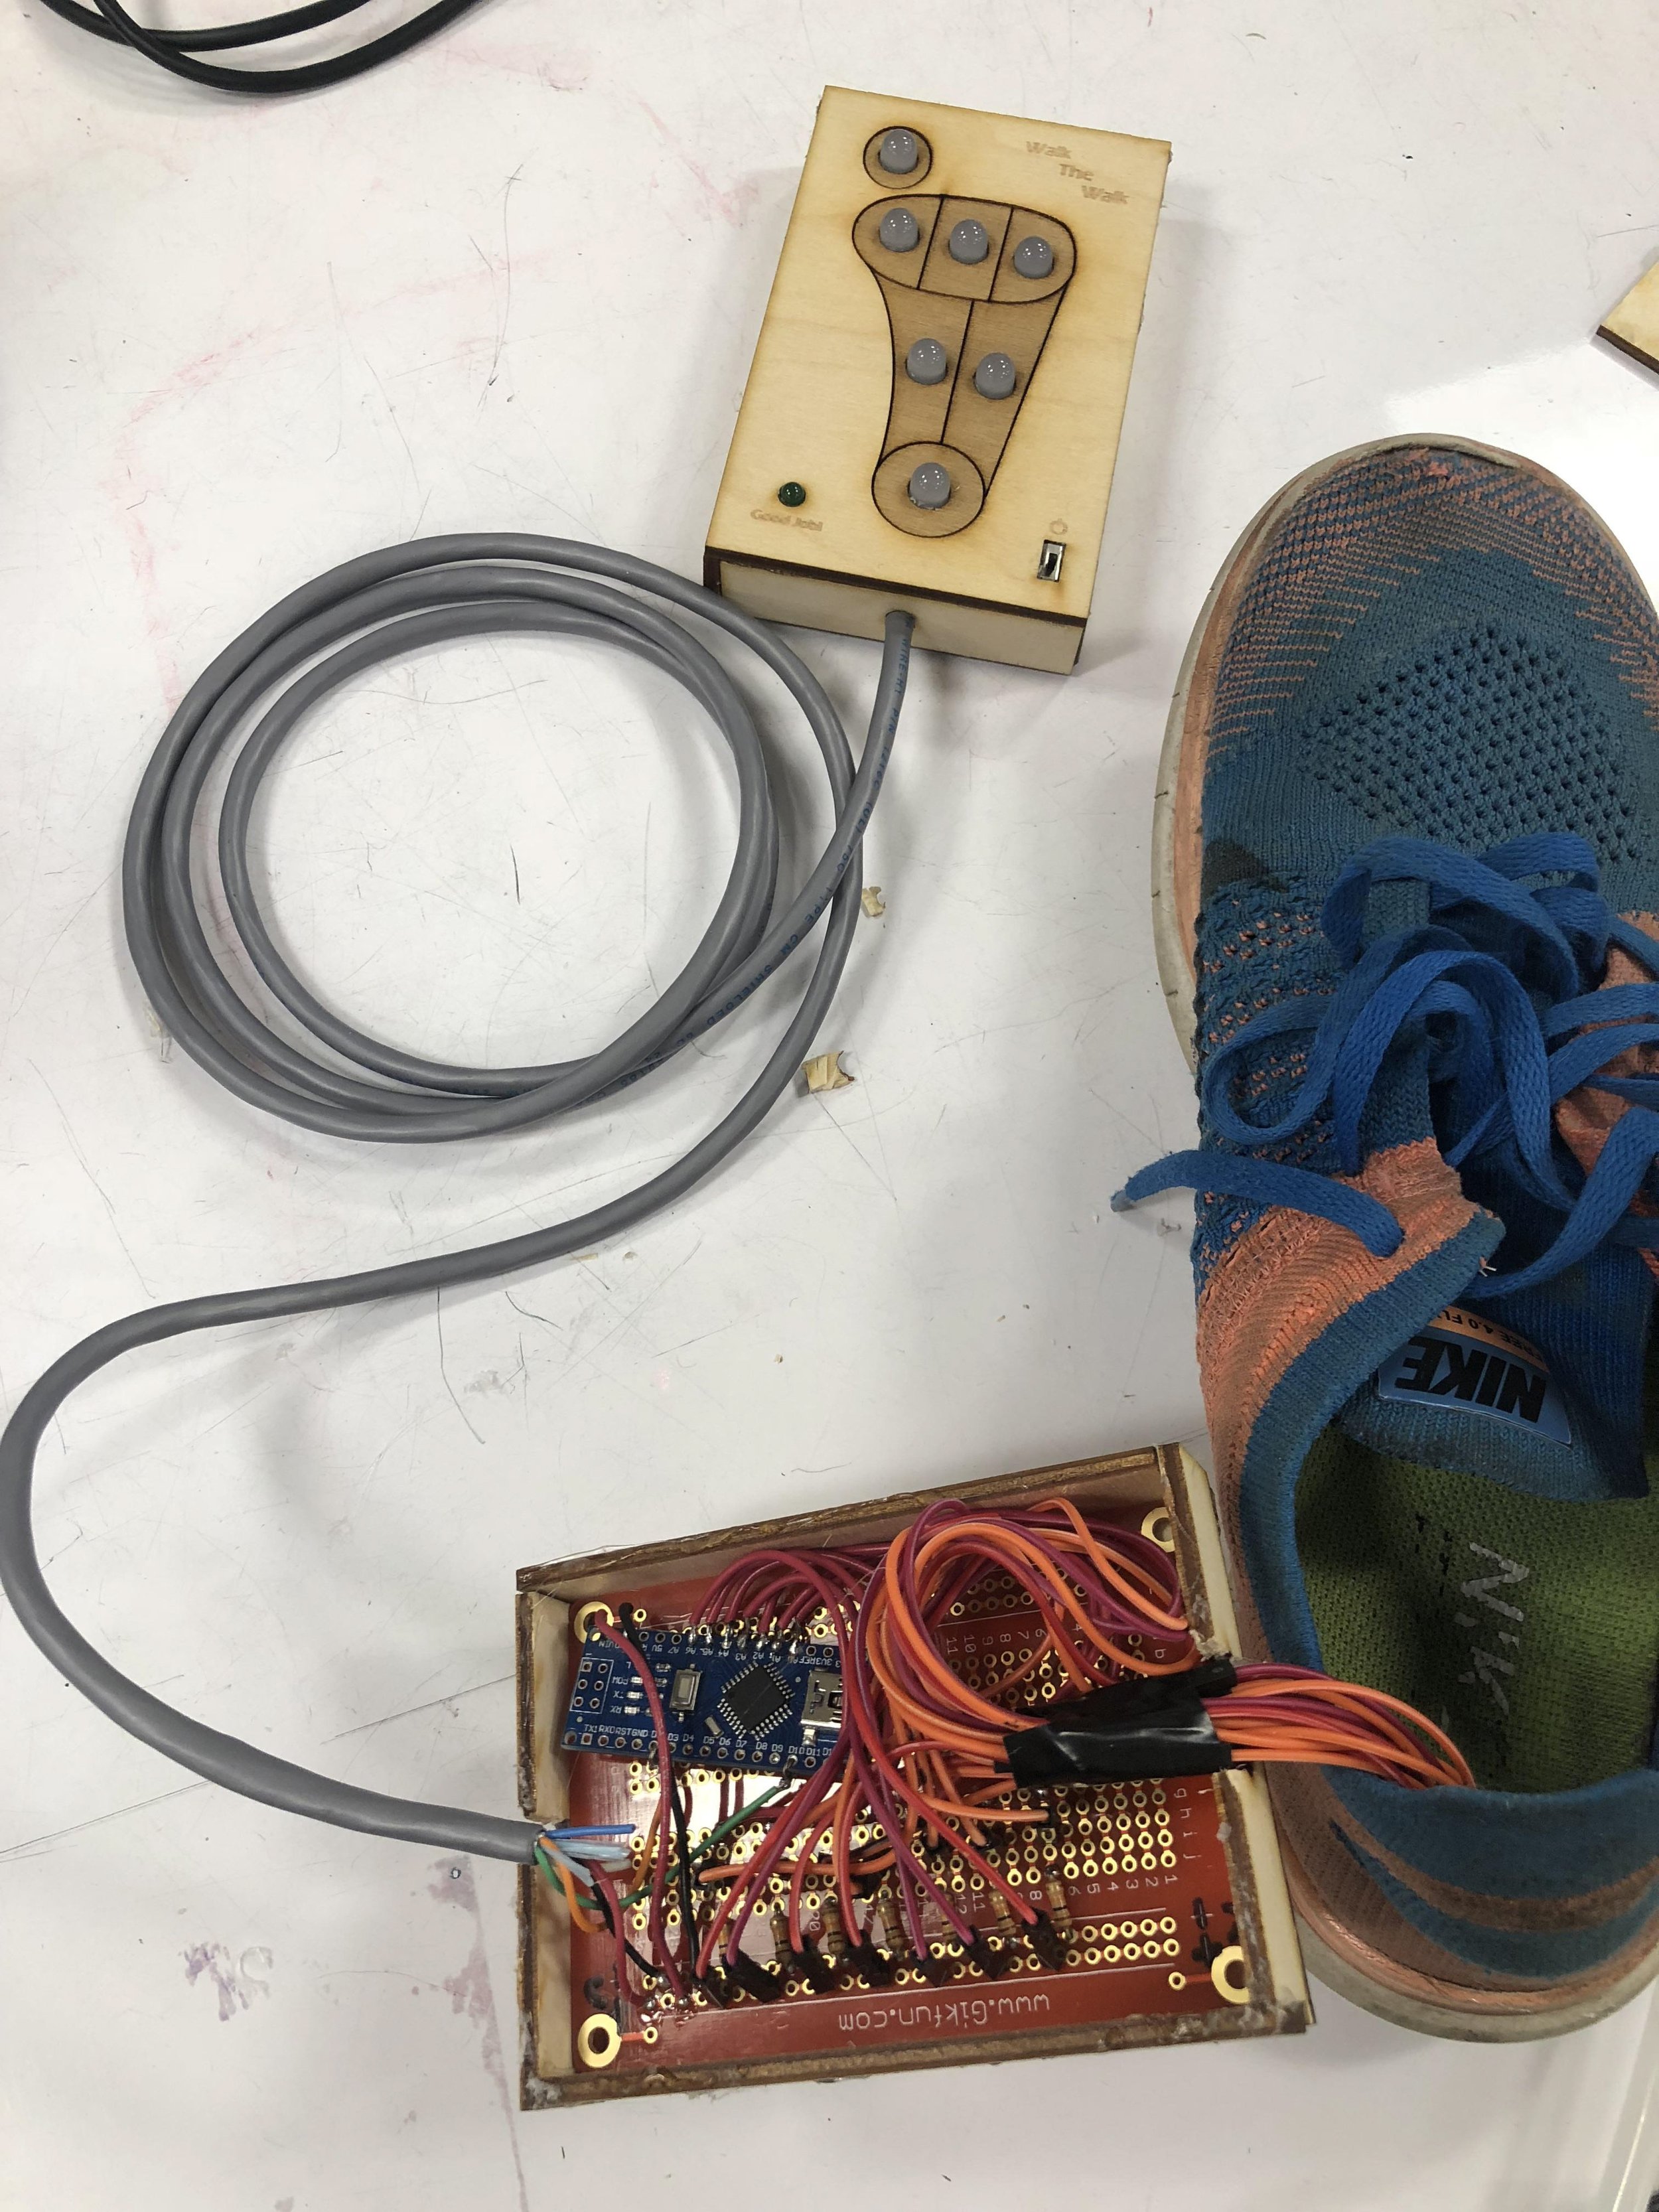
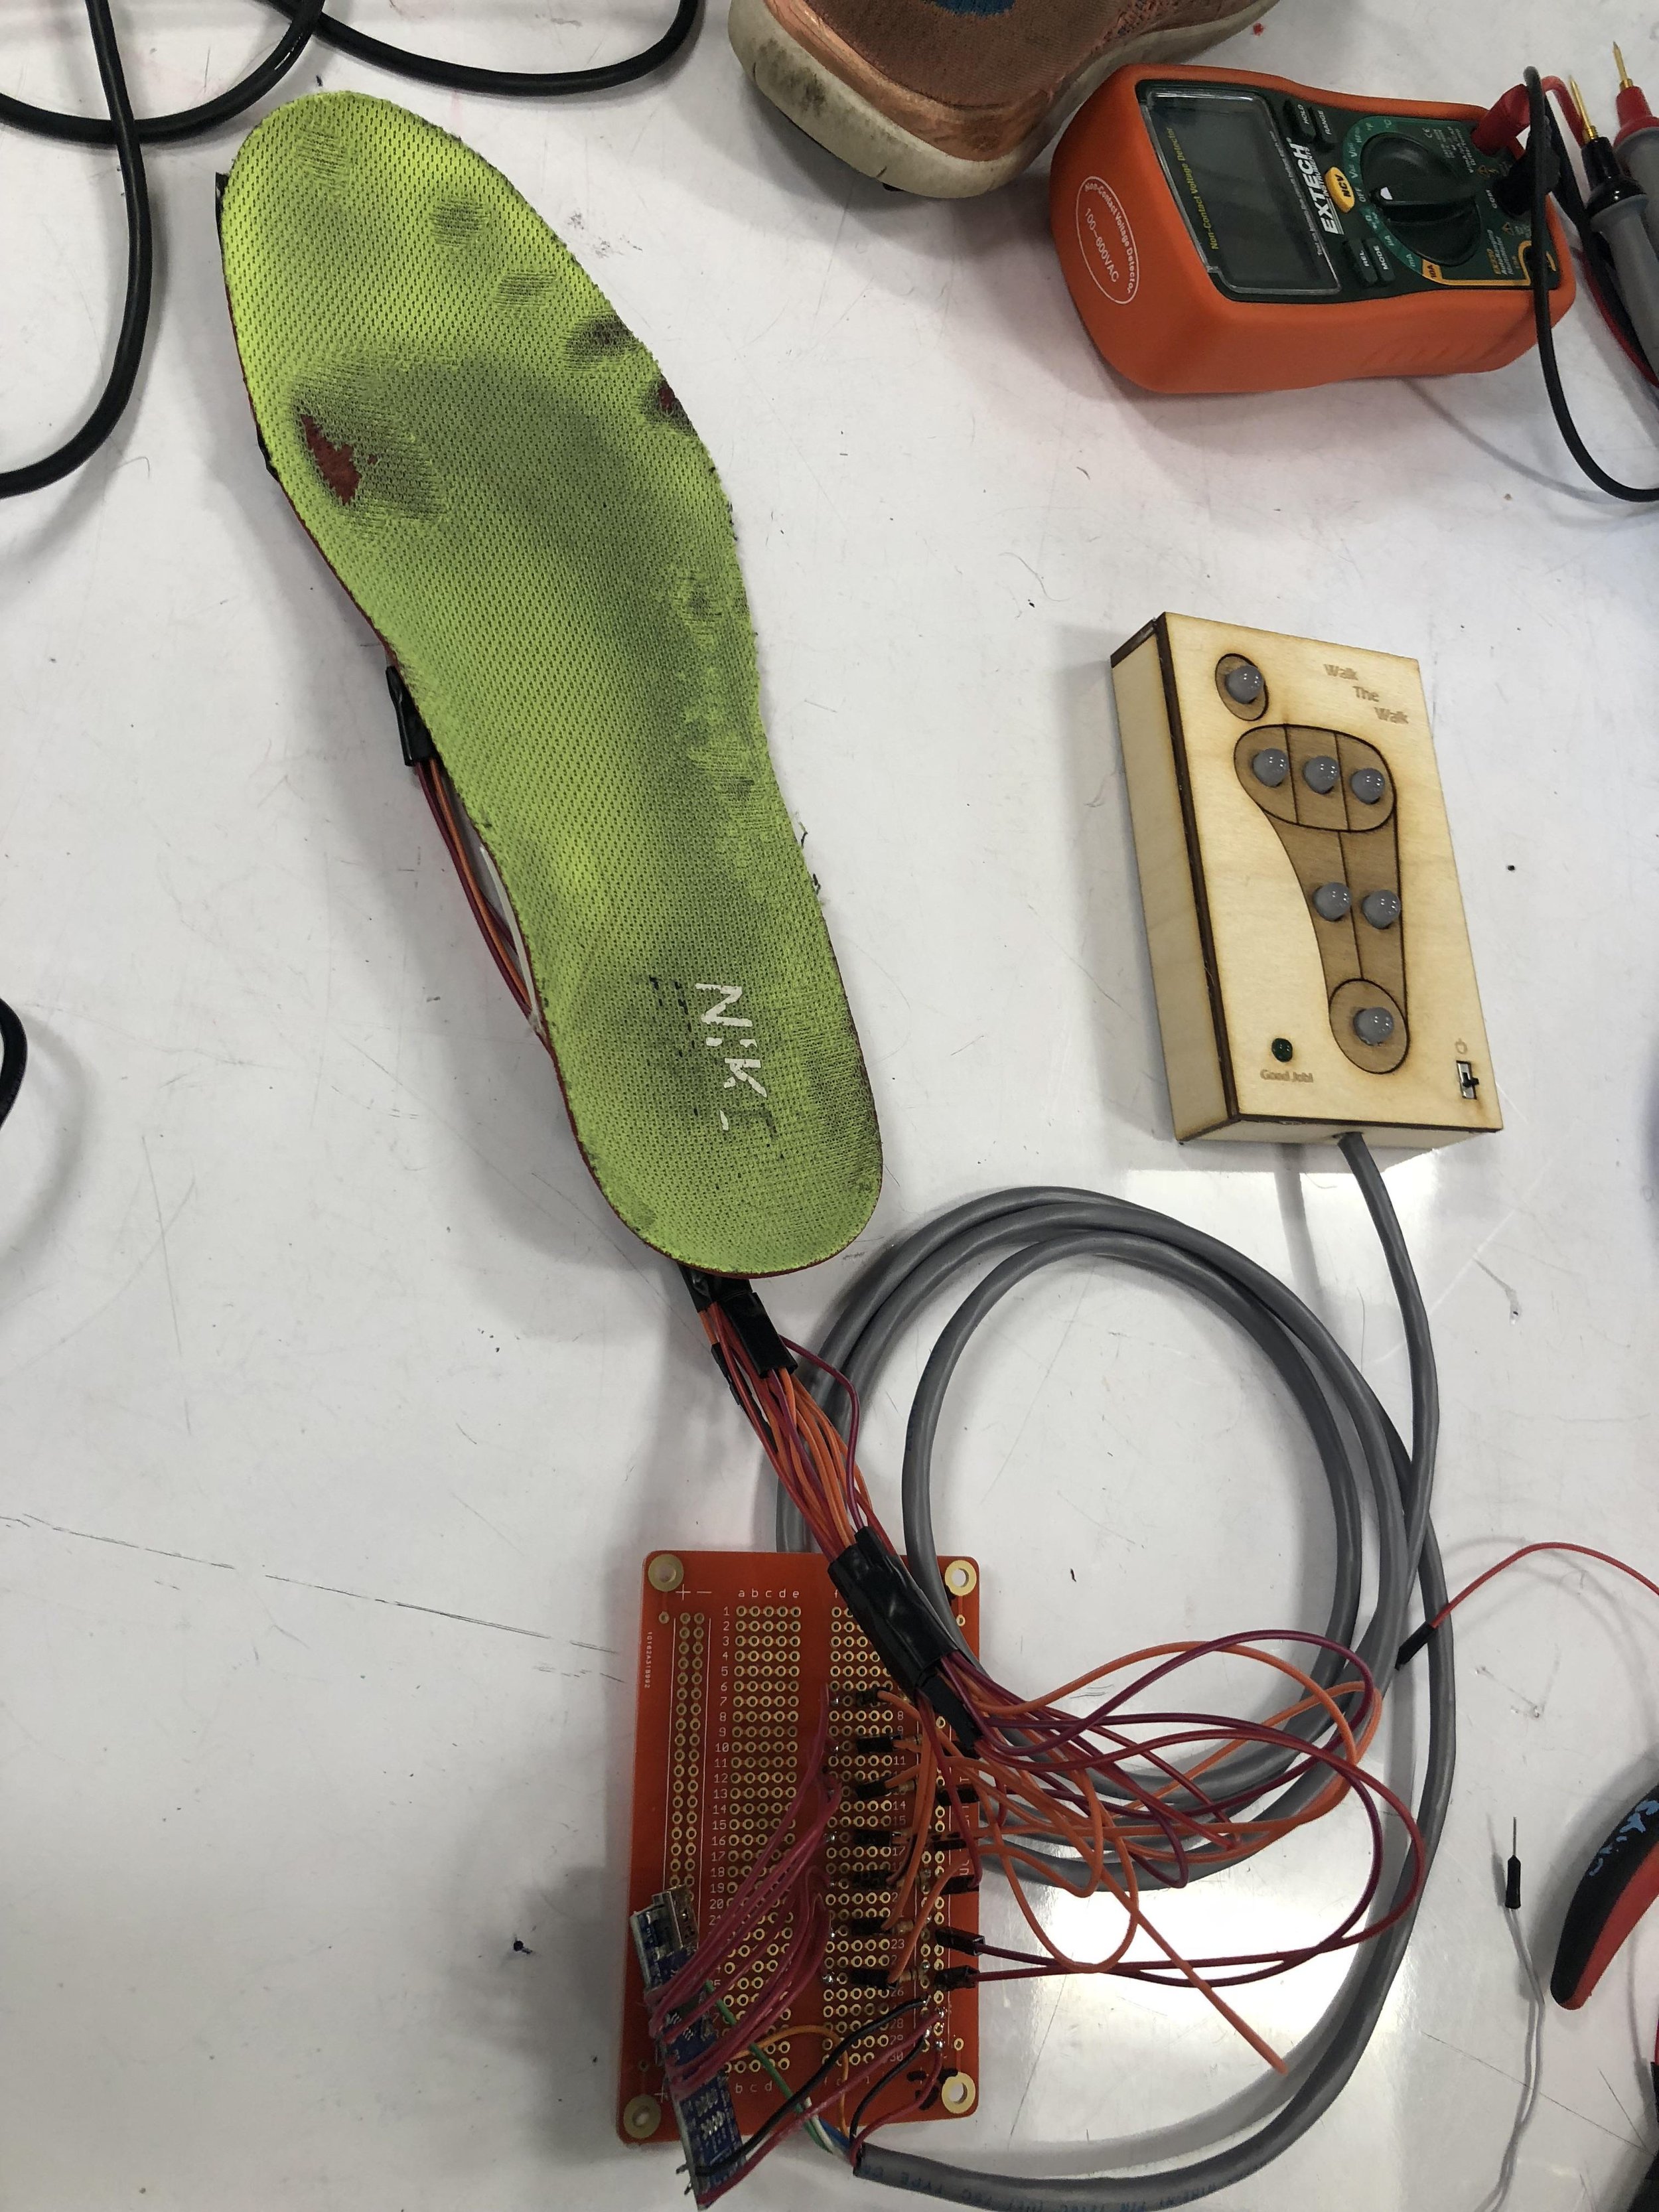
An overall shot of how the device would be used with the handheld display device, the anklet and the sensors in the shoe.

Animation of how the display functions as you move pressure from the bottom of the foot to your toes.
PROCESS
(Note: complete documentation of the final and the process can be found here.)
I am someone who has very bad walking habits. Ever since I was a kid, I knew I had the wrong pressure distribution when walking, which caused my knees to grow at a wrong angle. To fix that, I need to constantly remind myself to fix the way I walk. This device is designed to help me do that. It visually displays the pressure distribution plus tells me when I am putting the right amount of pressure.

Different brainstorming ideas for an assistive device.

I was inspired by Pedobarography– the science and mapping of foot pressure distribution. This is a healthy pressure distribution example.
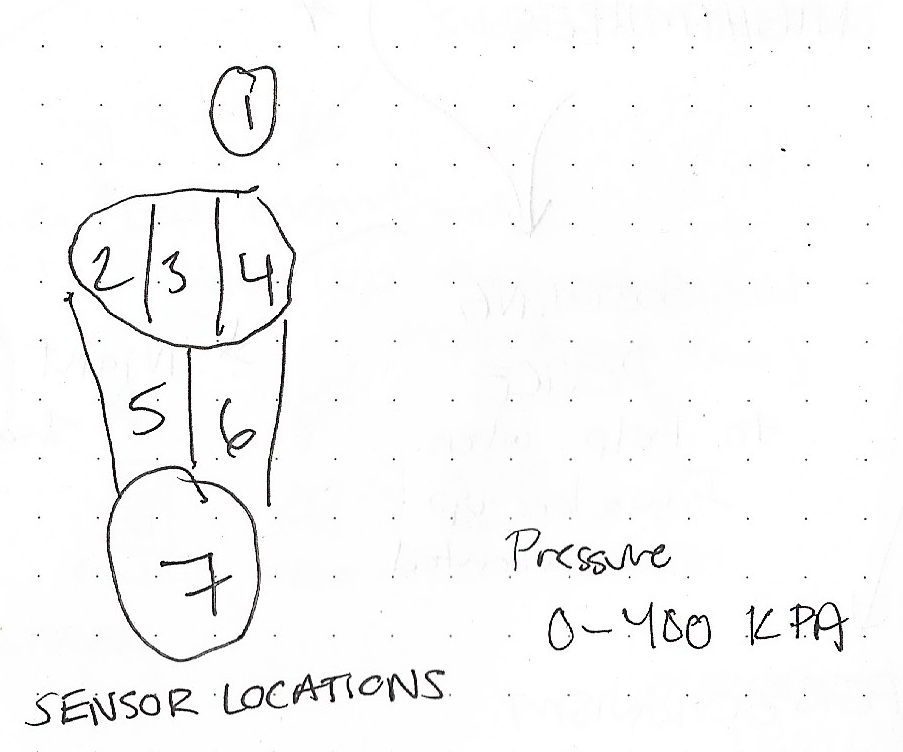
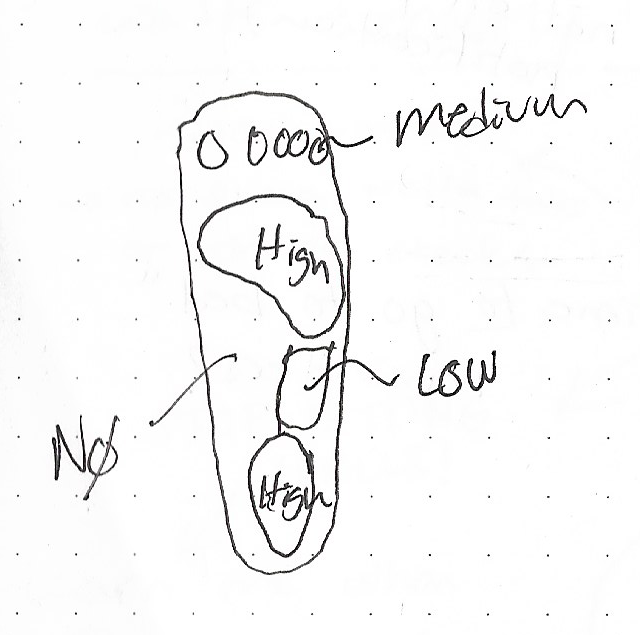
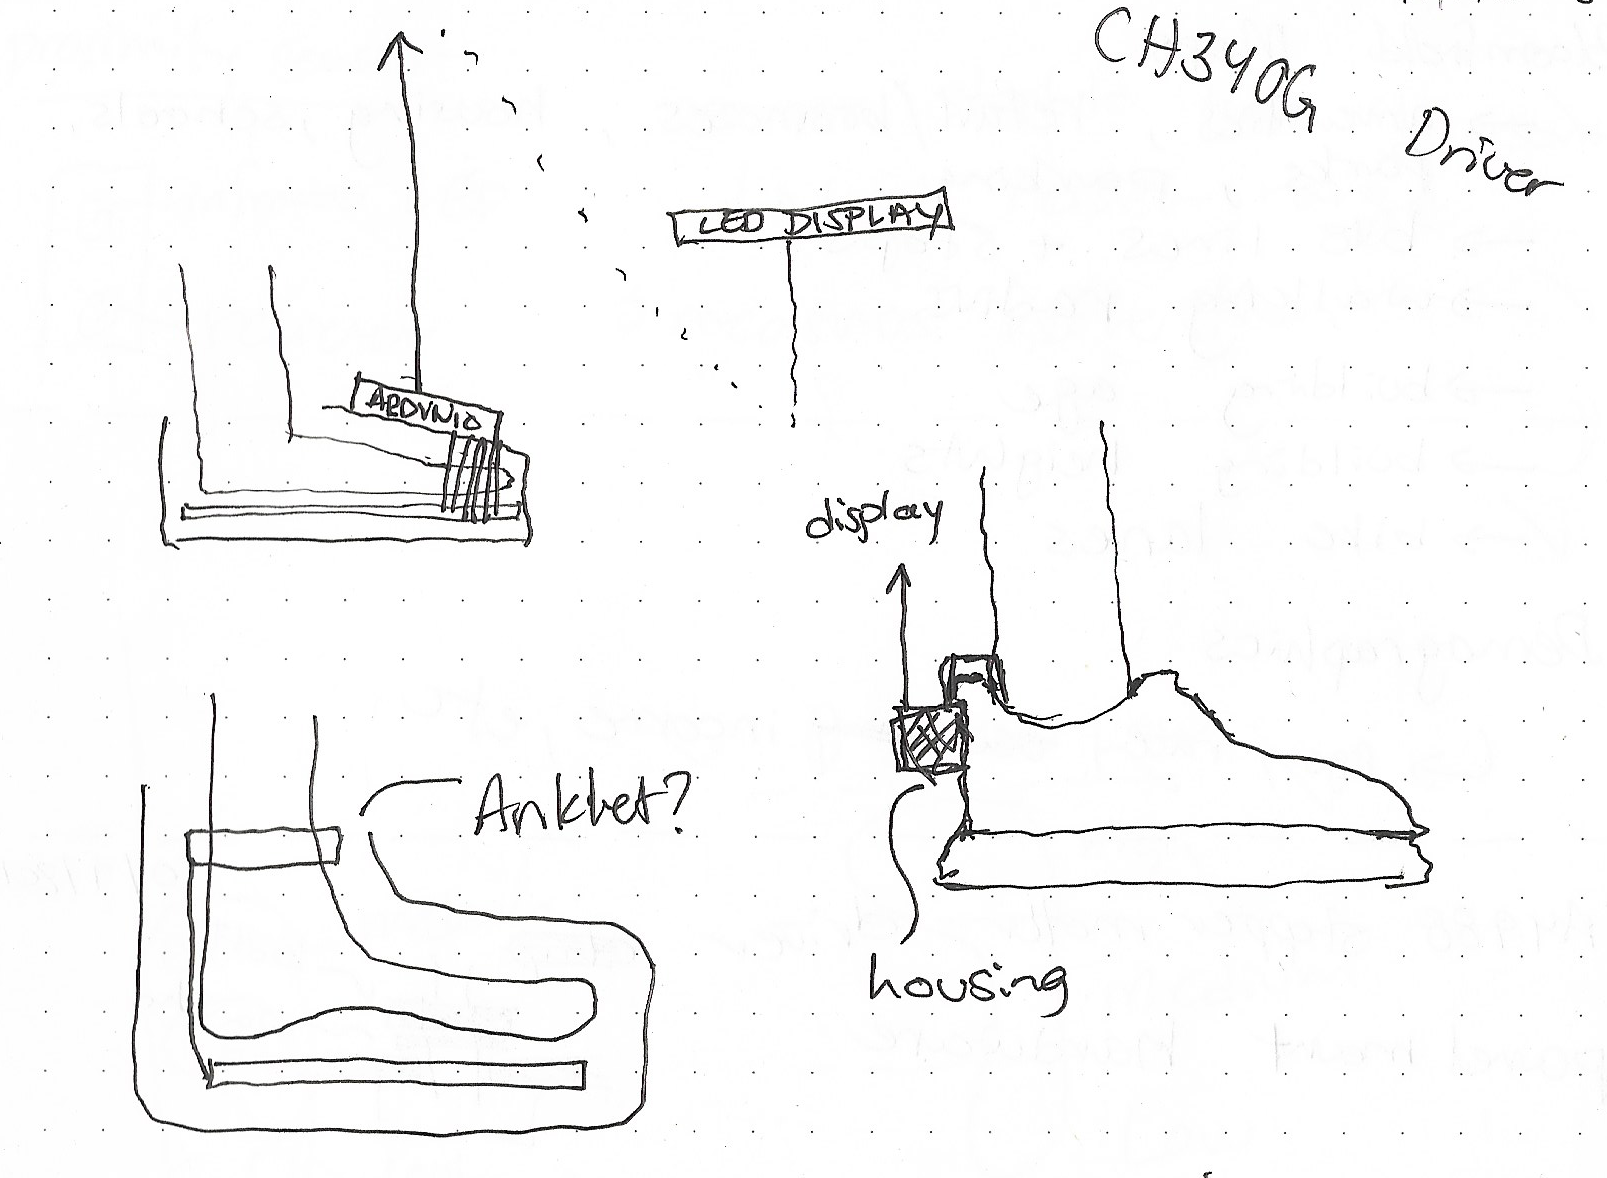
Based on extensive research on the topic, I started sketching ideas on different important pressure points, and how to correctly distribute weight on a foot. I figured these 7 zones are most important places for foot pressure.
After research and ideation, I decided the best way to go about making this it to simultaneously work on two components separately, and then join them once they are complete. The two components are the inputs, which are the pressure sensors, and the outputs which is their corresponding LEDs.

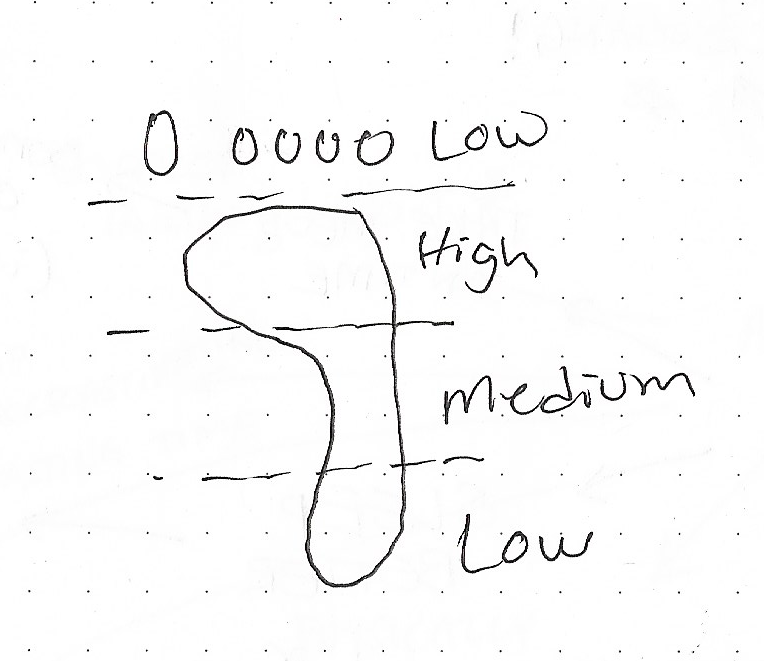
This sketch is the math I was trying to figure out to properly display RGB values on a 0-1023 range in a color gradient. Basically, as pressure increases, the LED goes from blue to green to red. The final values in the code was based on trial and error while using the shoe, to figure out the right values that makes the gradient look right.

For the “good job!” light: This sketch is deciphering the research and mapping out the correct pressure distribution for each zone. Then using the values corresponding the 0-1023 value read of the pressure sensor to help map out the correct corresponding RGB value.
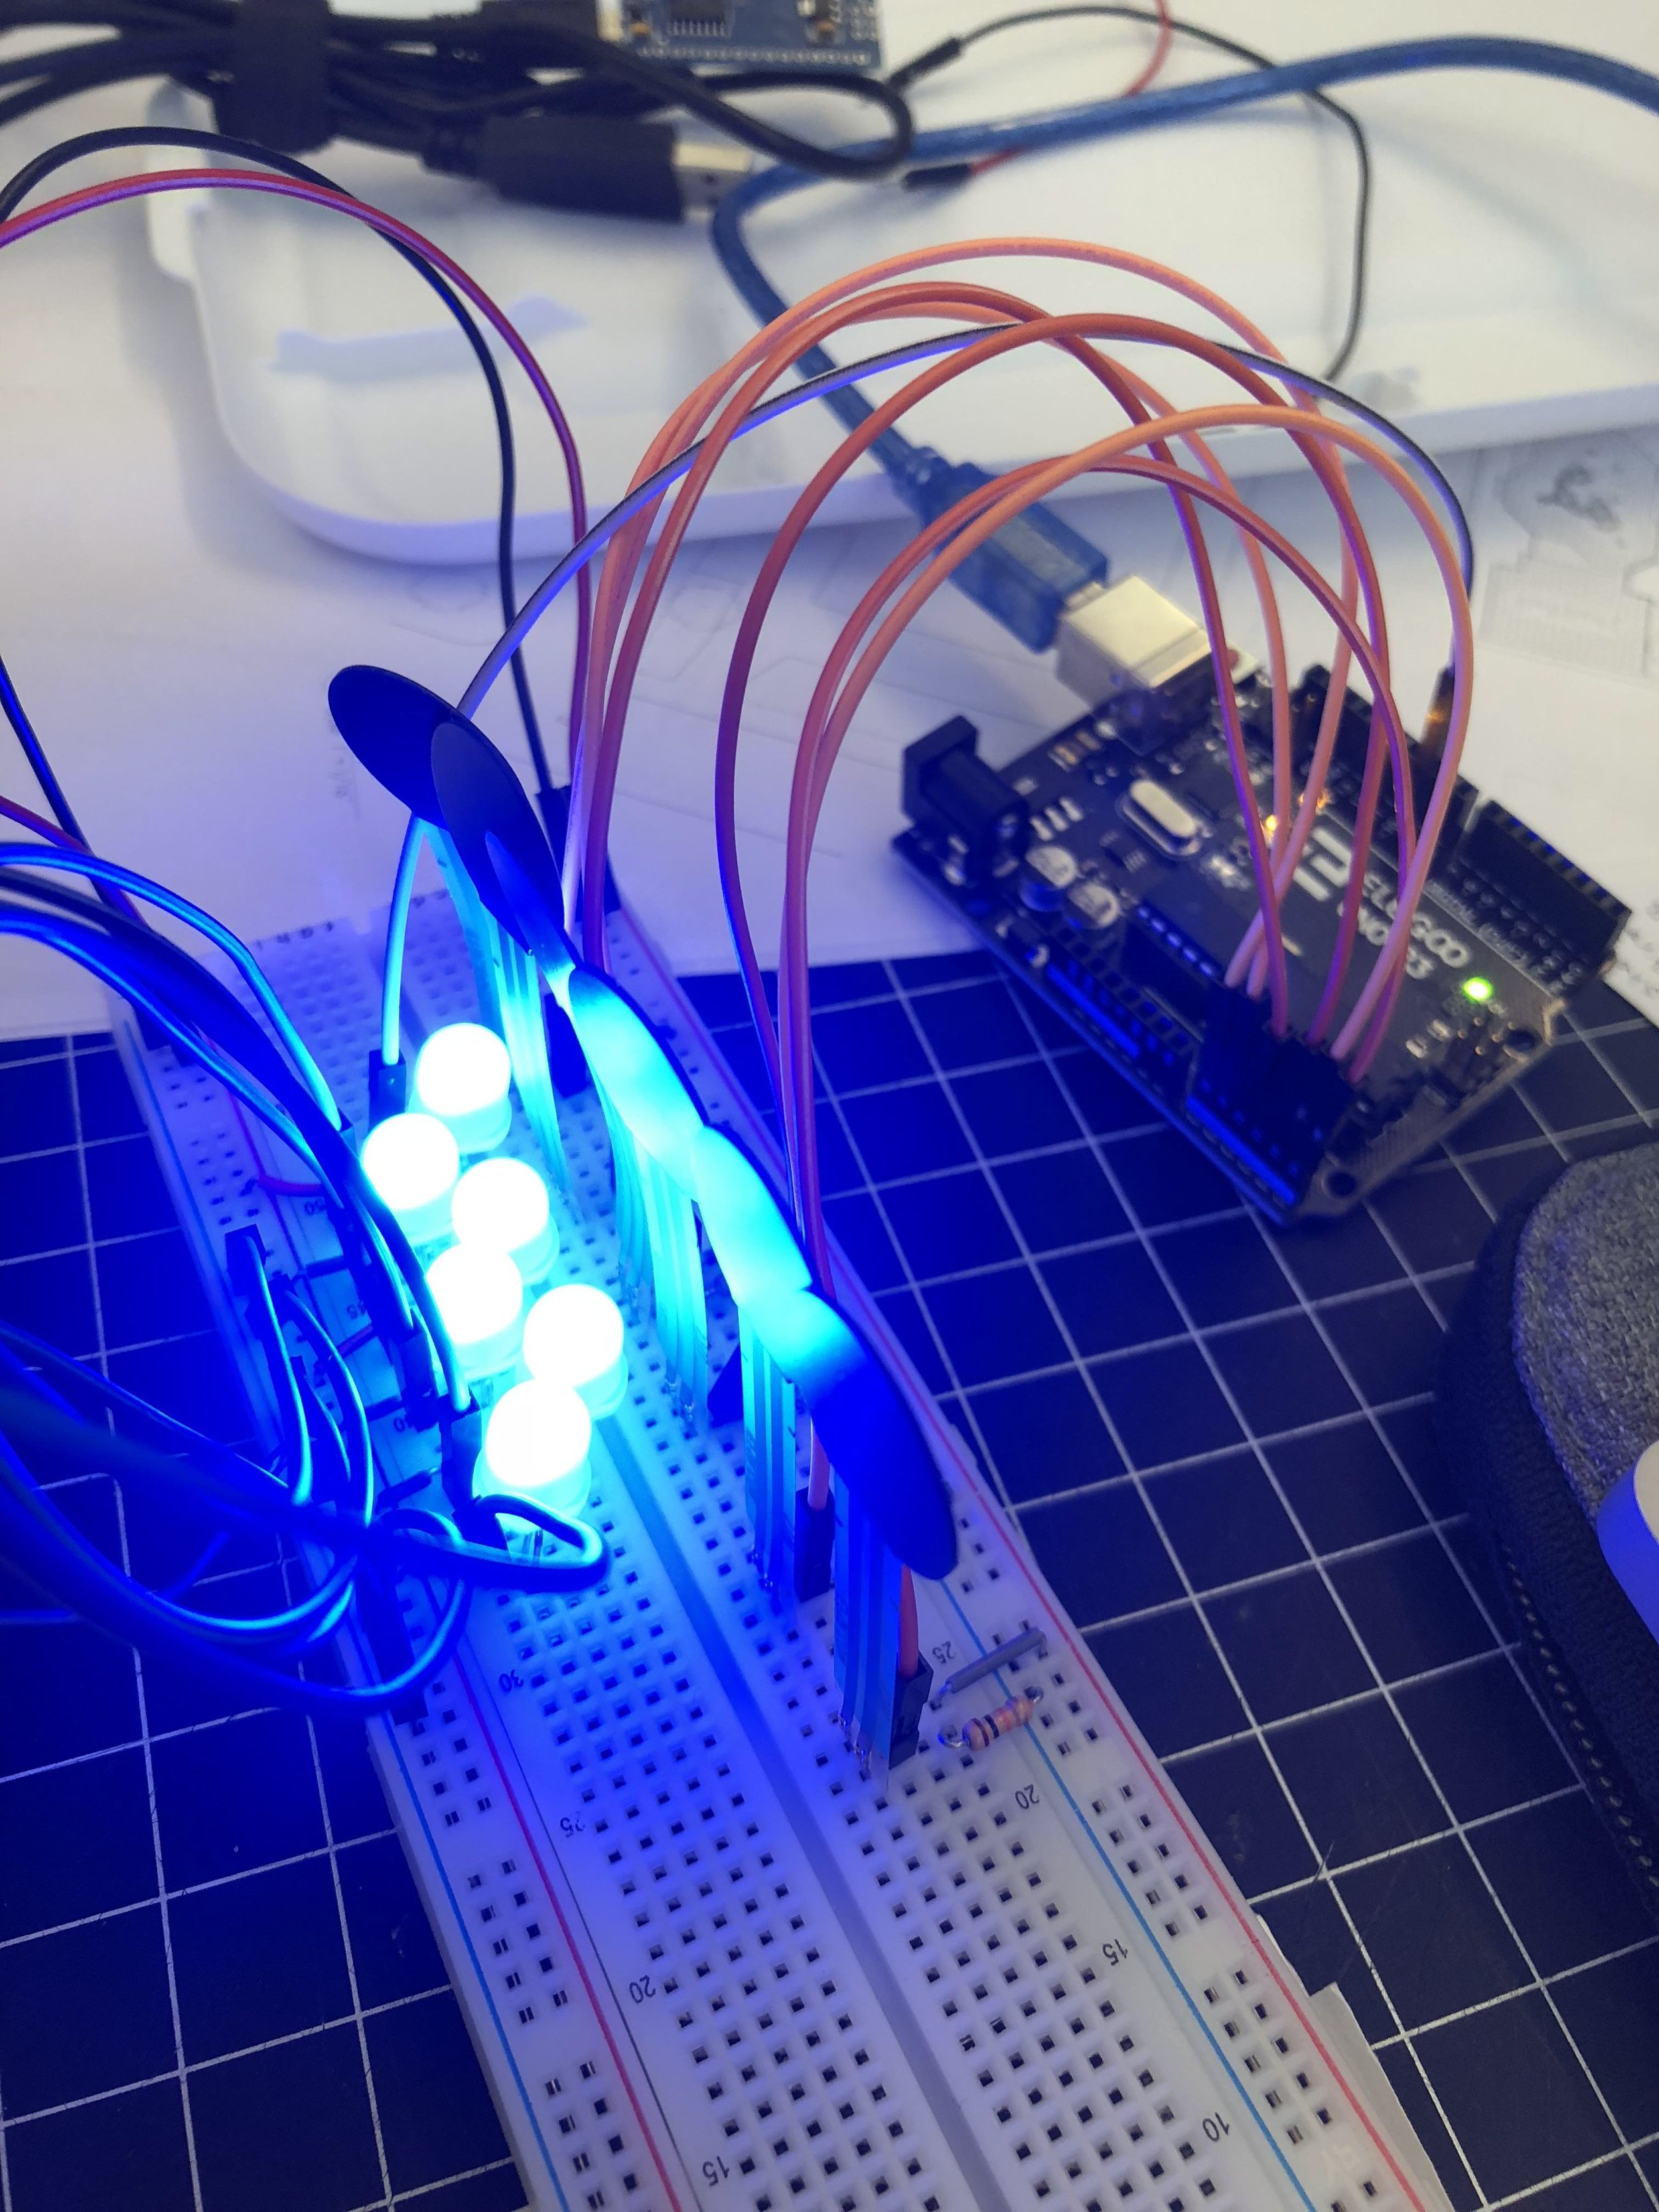
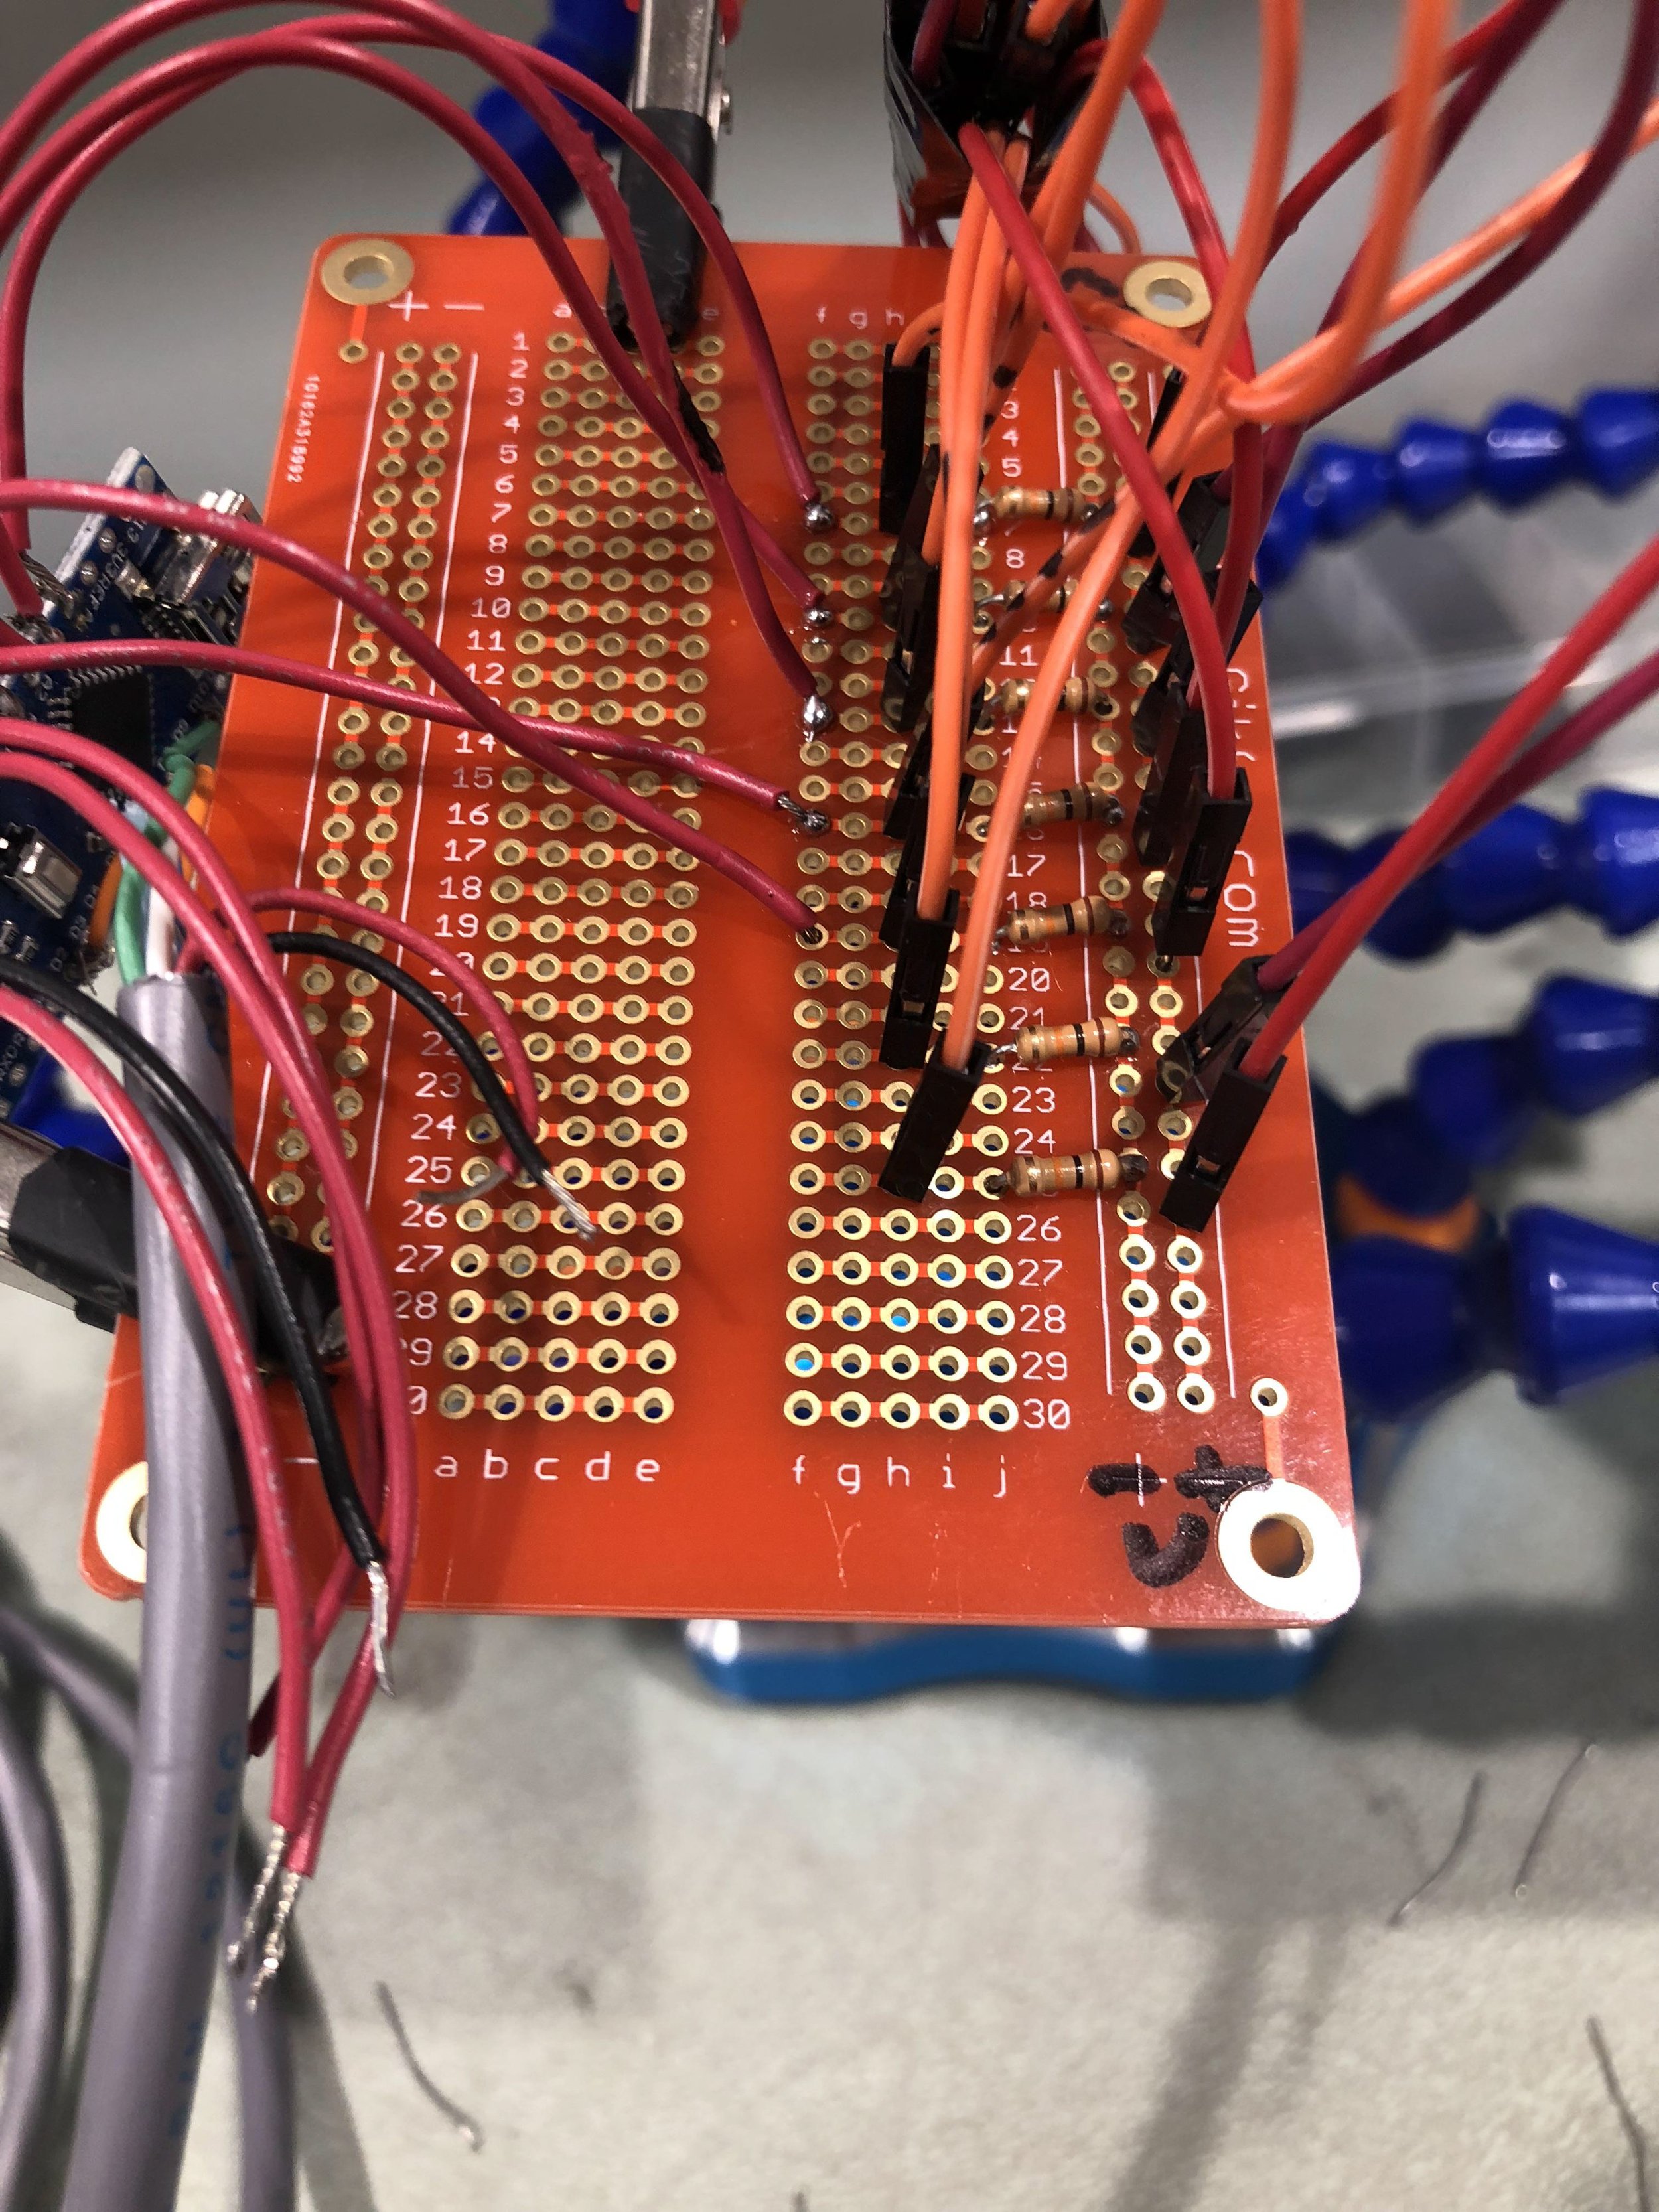
PART 1: GETTING THE PRESSURE SENSORS TO WORK AND MAP THE RIGHT COLORS ON THE LEDS

PART 2: TRANSFERRING THE SENSORS AND MAKING THE SHOE
Because I was using an old shoe, it was very helpful, because I could see where I put pressure on my feet, based on where it’s worn out-- that made transferring the zone diagram easier. The biggest issues I faced in this part was the fact that I was working with so many sensors and so some of them would shift out of place and disconnect, specifically, the ones higher up in the shoe.

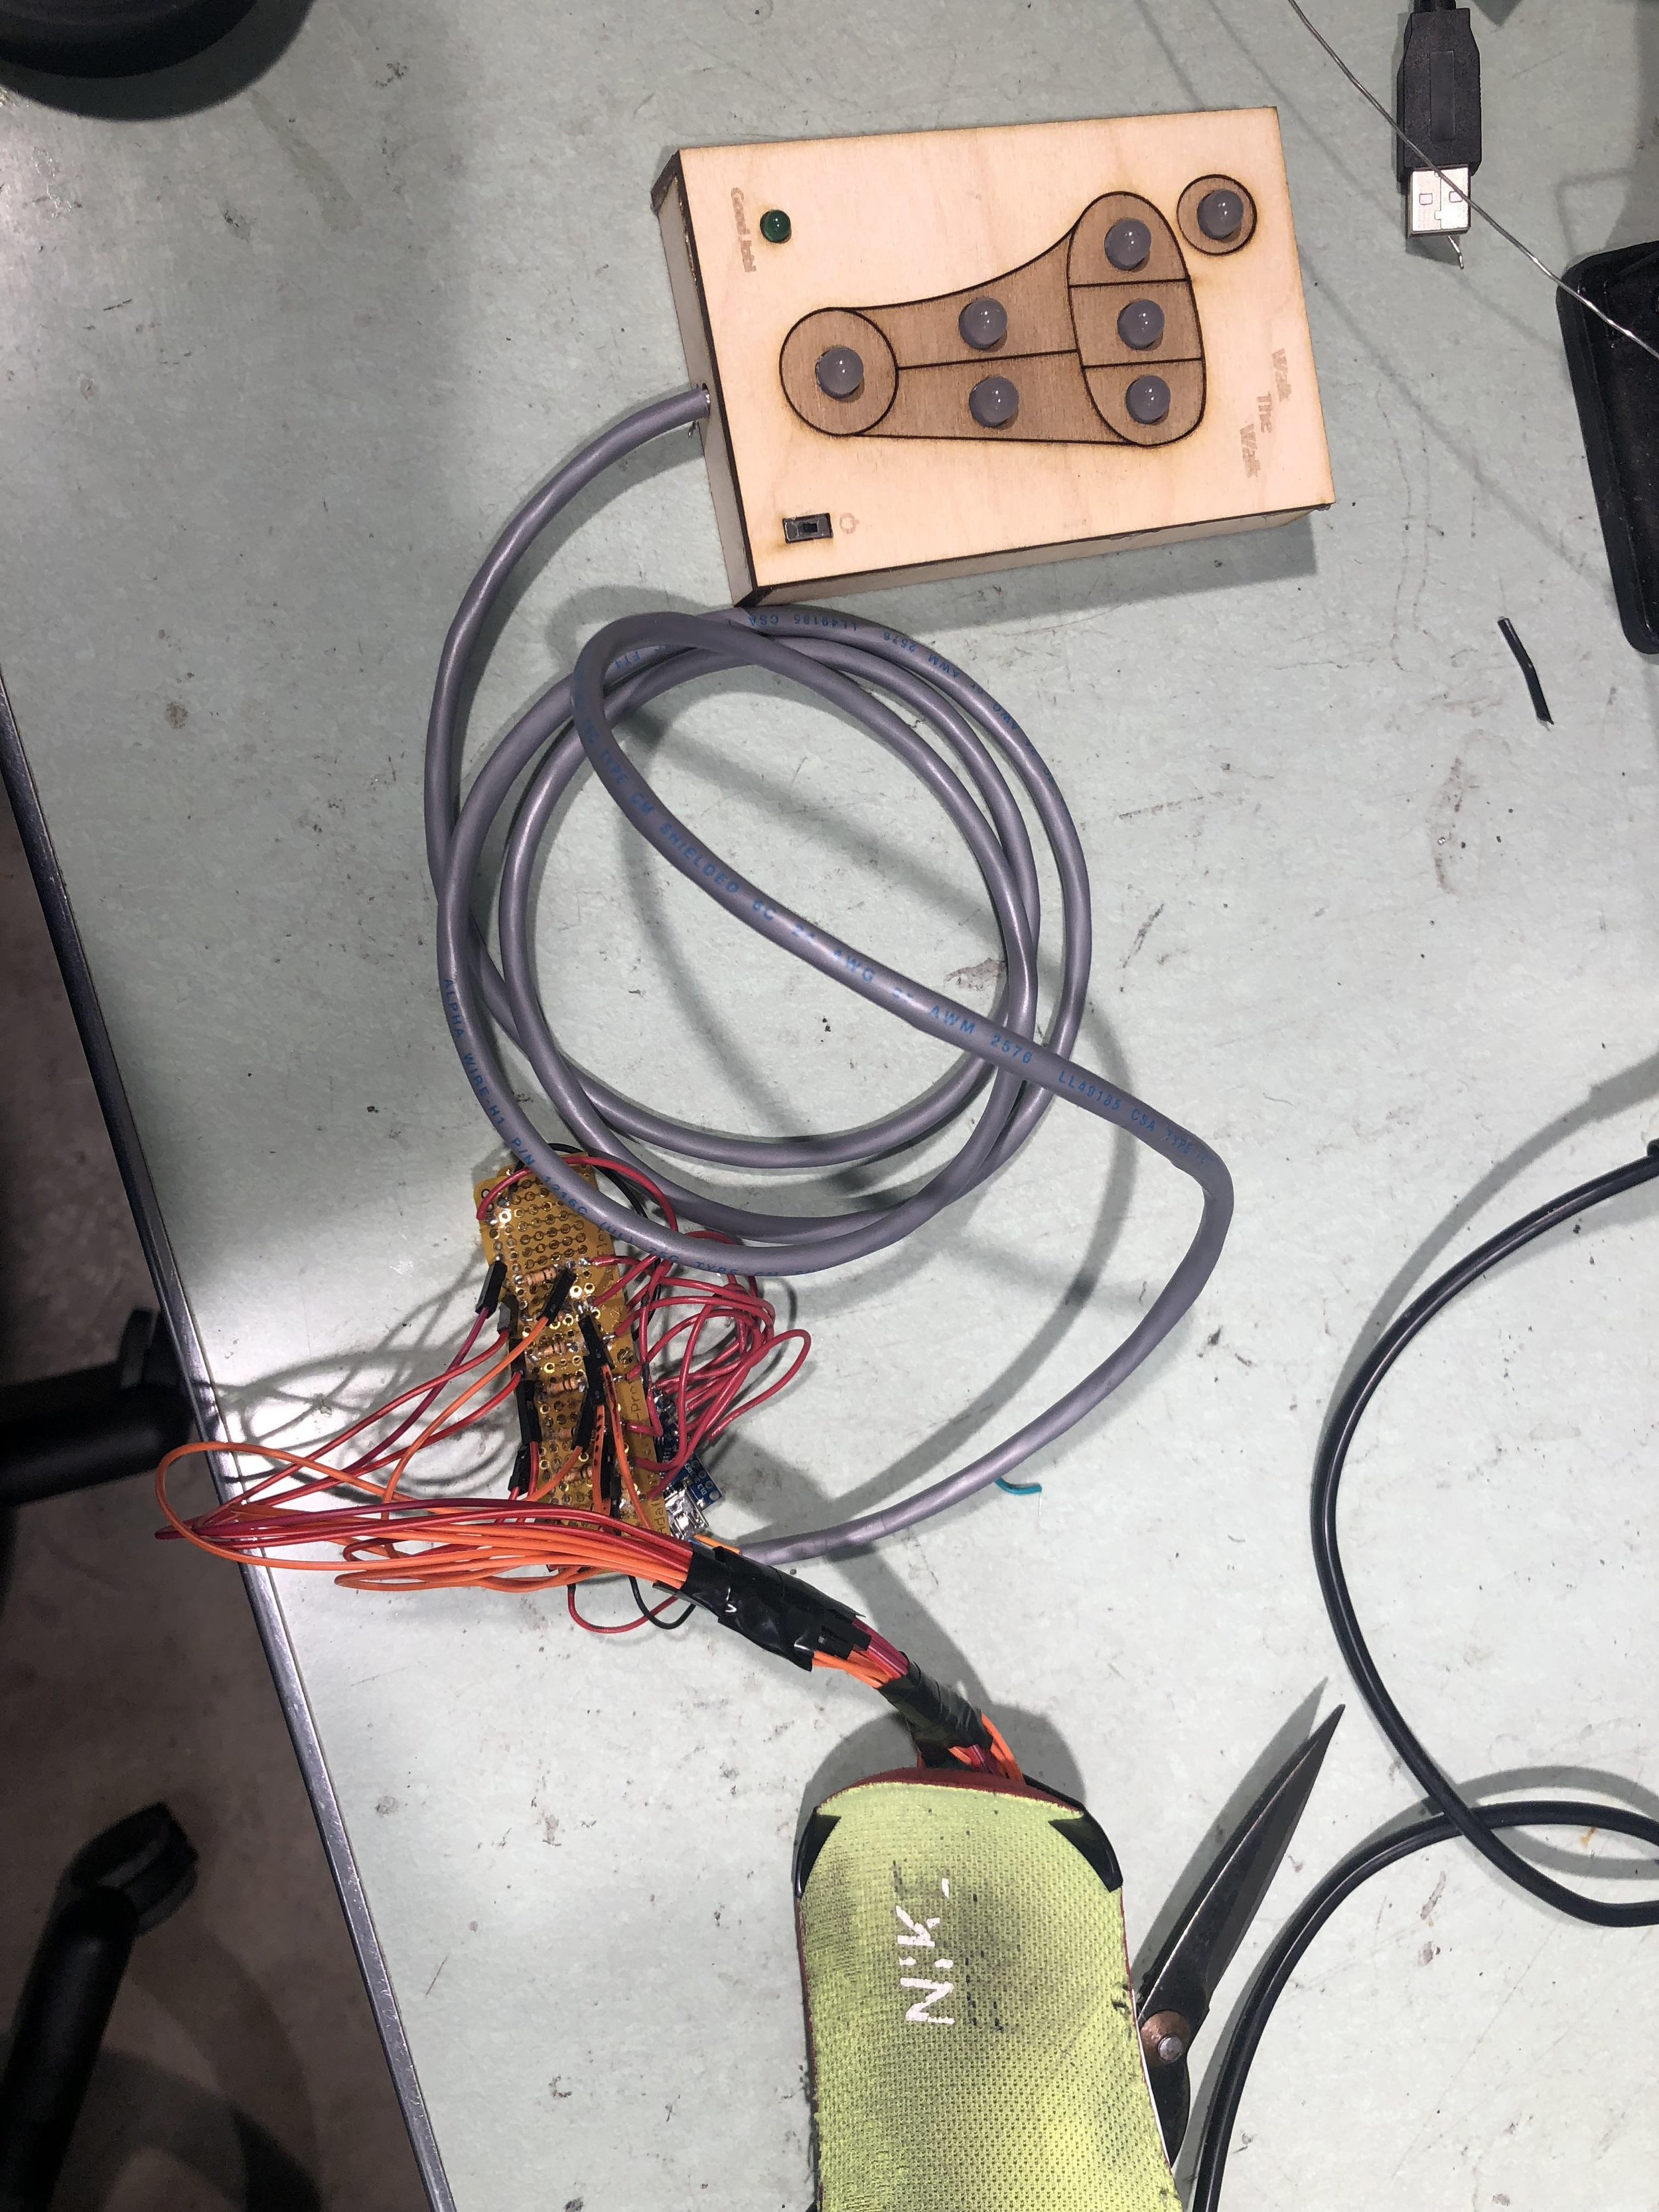
PART 3: BUILDING THE LED HOUSING
Once the shoe part was working well, it was time to transfer the LEDs to a handheld housing.

PART 4: MAKING THE ANKLET AND COMBINING THE LEDS AND THE PRESSURE SENSOR
Since this device involves a lot of user movement, I thought an anklet would be the best approach. I wanted to make the anklet as small and least intrusive as possible, so I used a flex soldering board.
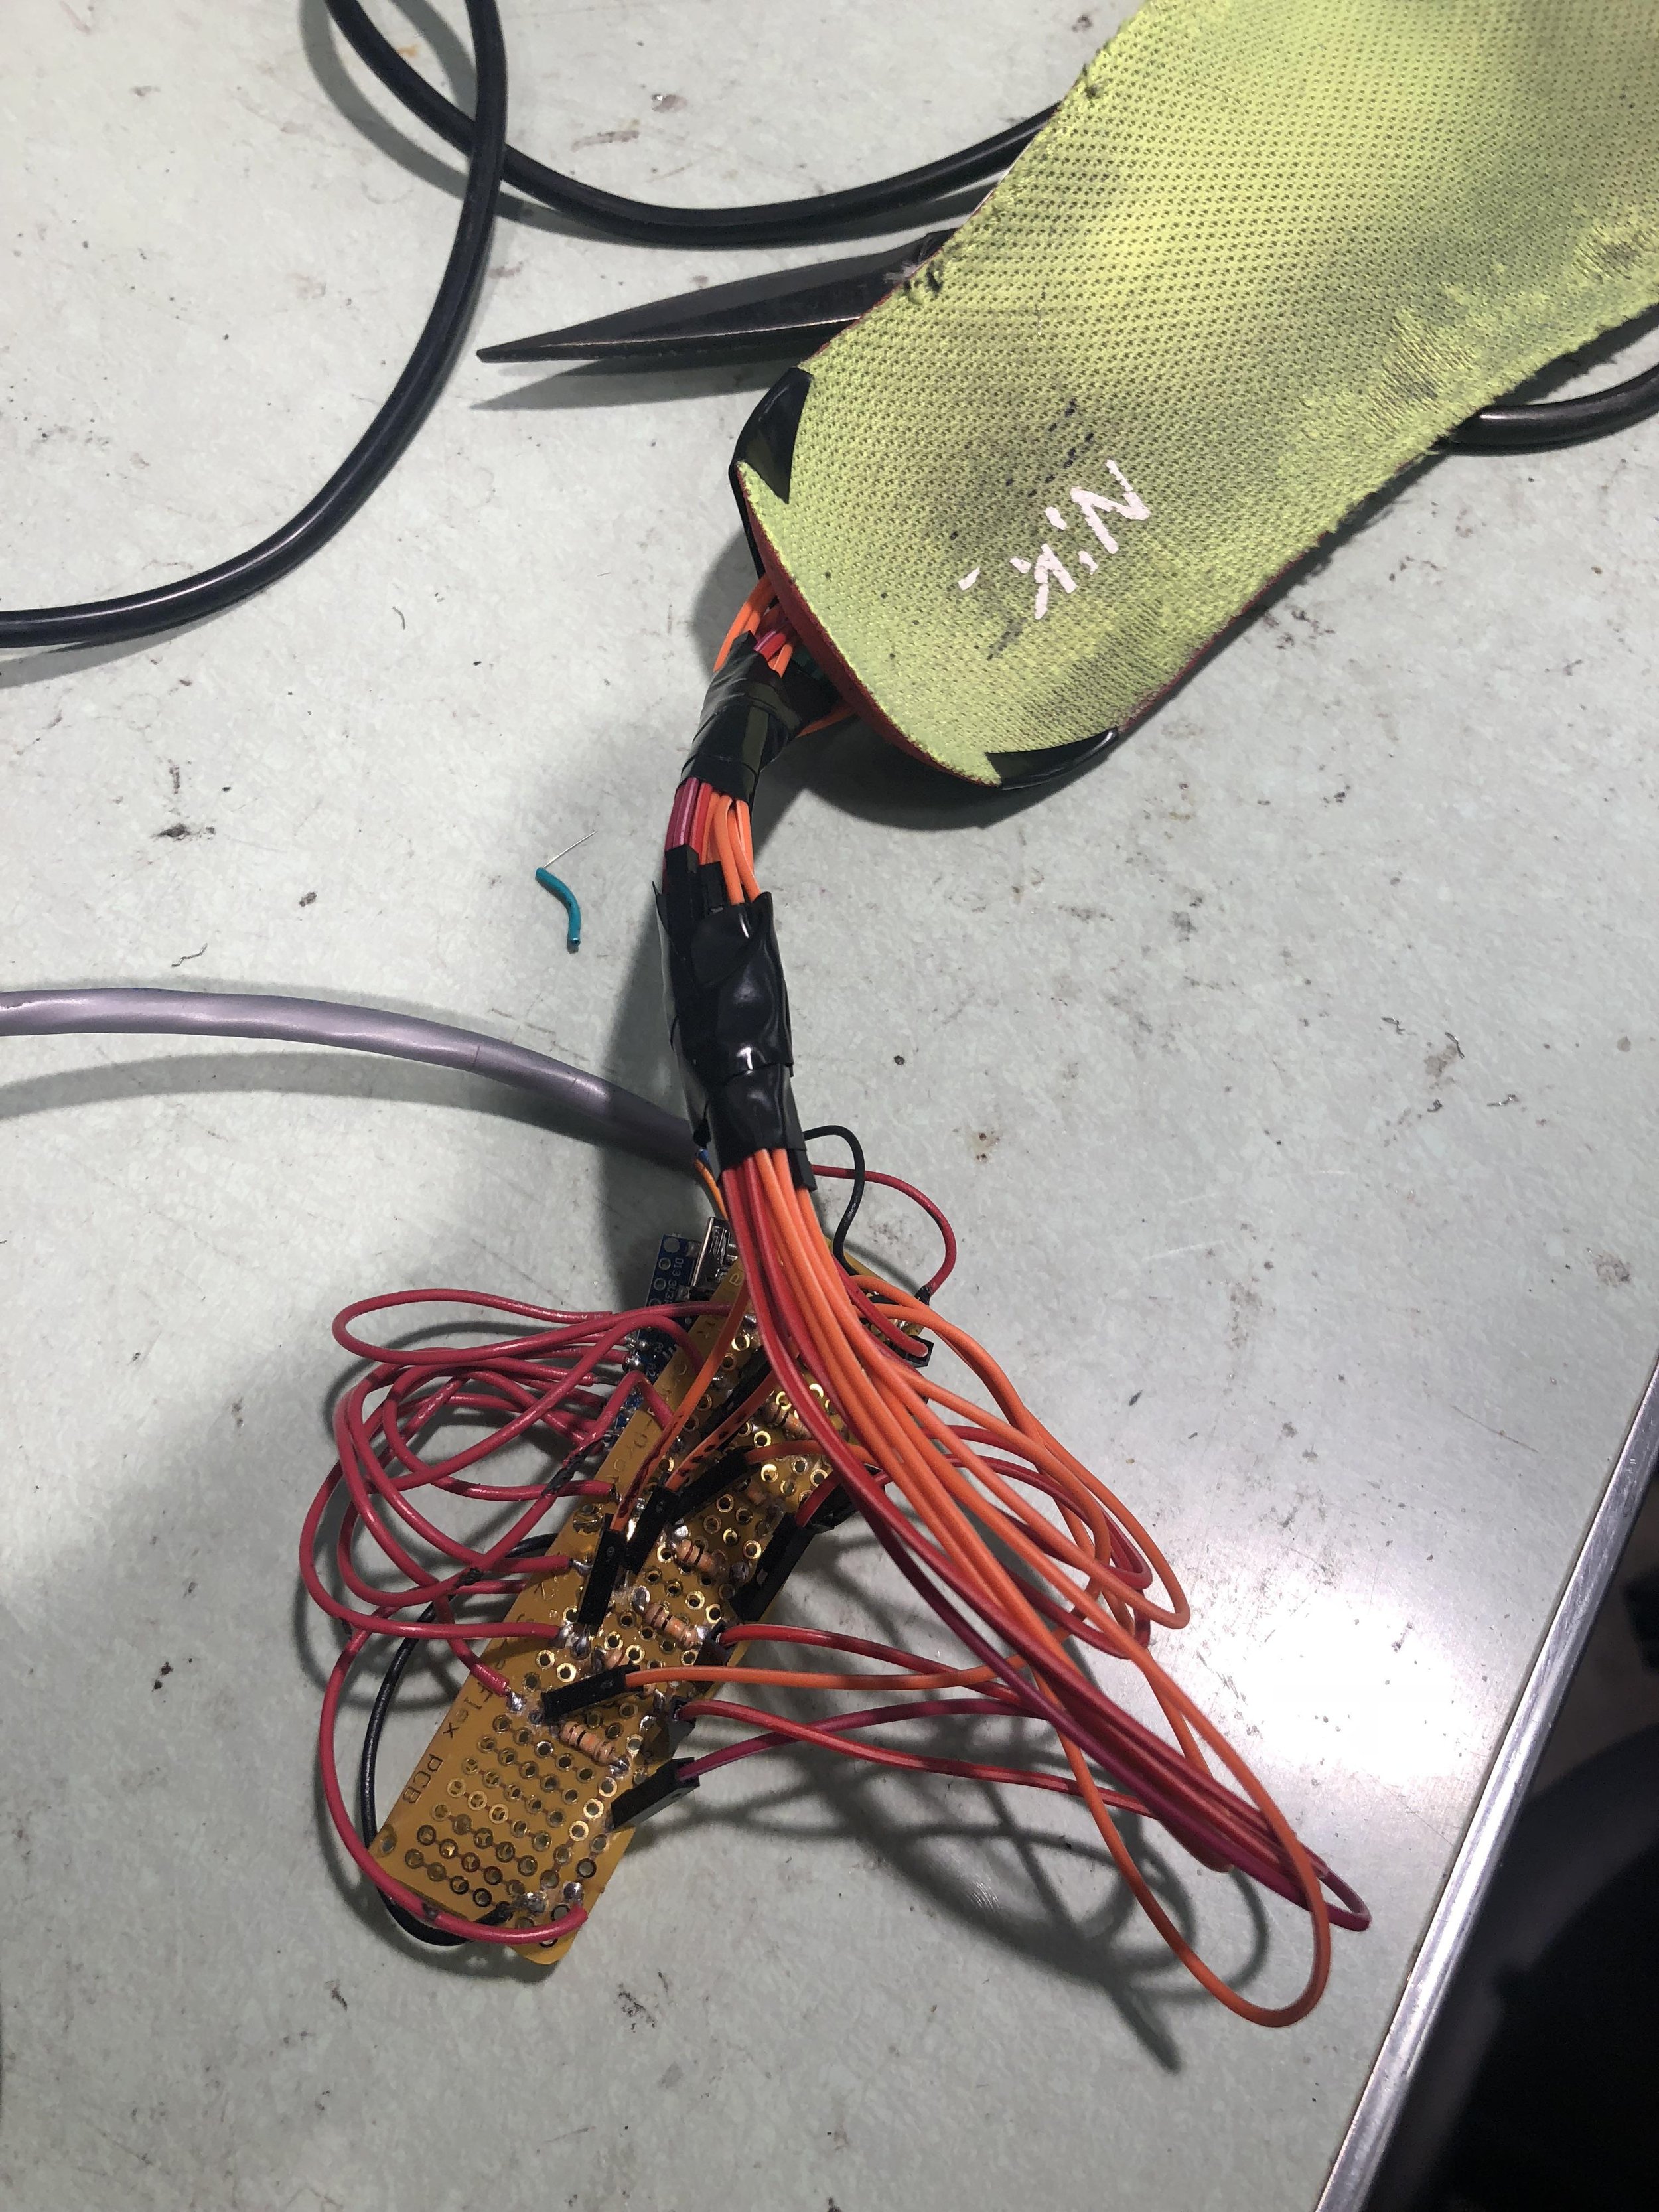
BIG MISTAKE!! The flex board was so flimsy and kept breaking and ripping. I kept having to fix it by soldering and re-soldering the connections on the board. At some point, I realized it would take more times to fix the flex board than to just start over with a new, more rigid board. I figured the anklet can grow a bit bigger if it meant the device worked more reliably. And so, I started over….

Alas! The anklet is complete, rigid, and the device works well.
